







Remote Patient Monitoring App Development: What It Takes, What It Costs, and Whether It Pays

Remote patient monitoring app development means building the system that collects physiologic readings from a patient at home, gets them to a clinical team, and produces the evidence a practice needs to bill for the service.

That last part is where most of these projects quietly fail. The app works, the readings arrive, and then the practice discovers it cannot prove it met the conditions attached to the billing codes.

I spend most of my time on the scoping side of healthcare builds, and remote patient monitoring is the category where the gap between a working product and a viable programme is widest. The technology is not the hard part. The challenge is getting the device, data pipeline, clinical workflow, billing logic, and patient experience to work as one system.

That is also why choosing a mobile app development company for an RPM project requires looking beyond the app itself. The team needs to understand connected devices, healthcare integrations, compliance, and the operational rules that determine whether the programme actually works.

This guide covers the 2026 billing rules and what they mean for your architecture, device sourcing, designing for patients who will not open an app, what a build costs, how long it takes, and a model for working out whether the numbers close.

If your platform cannot tell you, per patient and per 30-day cycle, exactly how many days of data arrived, you have not built a remote patient monitoring product. You have built a dashboard.

Key Takeaways

  • A patient who transmits readings on 12 days used to earn a practice nothing. Under the new code, that month is billable at a national average around $47.
  • Accurate day-counting is now the difference between two codes rather than the difference between payment and nothing. That makes it a product requirement, not a billing chore.
  • Readings must be transmitted digitally from an FDA-cleared device. Anything a patient types in by hand does not count.
  • An RPM build runs roughly $60,000 to $400,000 depending on scope, and the programme, not the app, decides whether it pays back.
  • One of four Mayo Clinic RPM pilots enrolled zero patients and was discontinued. Enrolment is the risk nobody budgets for.

What a Remote Patient Monitoring App Actually Does

Four jobs, and everything else sits on top of them.

Collect physiologic readings from a device in the patient’s home. Transmit them somewhere clinicians can see them. Flag the ones that need attention. Record what the clinical team did about it.

The readings are usually blood pressure, weight, blood glucose, pulse oximetry or heart rate. The devices are cuffs, scales, glucometers and pulse oximeters, and they reach your platform over Bluetooth through a phone, or over a cellular connection with no phone involved at all.

That second option matters more than it sounds, and I will come back to it.

RPM overlaps with telehealth without being the same thing. A telemedicine app development project is built around a scheduled interaction between two people. An RPM build is built around a continuous stream of data that nobody is watching in real time, which is a different engineering problem and a different clinical risk. The broader shifts pushing both are covered in our healthcare software development trends piece.

Is Remote Patient Monitoring Profitable? The 2026 Billing Rules That Decide It

In the United States, RPM revenue runs through Medicare billing codes, and on 1 January 2026 those codes changed in a way that most published guidance has not caught up with.

CMS released the CY 2026 Medicare Physician Fee Schedule final rule on 31 October 2025, effective from the start of this year. It added new remote monitoring codes for the first time since the original set was created.

Here is the picture as it now stands.

Code What it covers Threshold
99453 One-time setup and patient education At least 2 days of data (lowered from 16)
99445 New. Device supply for a 30-day period 2–15 days of transmitted data
99454 Device supply for a 30-day period 16 or more days of transmitted data
99470 New. First 10 minutes of management in a calendar month At least one real-time interactive communication
99457 First 20 minutes of management in a calendar month Includes interactive communication
99458 Each additional 20 minutes Added to 99457

What the 2026 CMS RPM Codes Changed

The change that matters most is 99445. Before this year, a patient who transmitted readings on 12 days out of 30 produced real clinical work and zero revenue. The month was written off. That month is now billable, at a national average around $47.

The management codes got the same treatment. A clinician who spent 14 minutes on a patient used to bill nothing, because the threshold was 20. The new 10-minute code, valued at roughly half of the 20-minute code, covers that month.

What this changes about the build: Day-counting used to decide whether you got paid at all. Now it decides which of two codes you claim. That sounds like a softening, and commercially it is. Architecturally it is the opposite, because your platform now has to count accurately enough to pick between codes every cycle, for every patient, and stand behind the answer in an audit.

RPM Billing Conditions That Change How You Build

A few conditions carry directly into product decisions.

Measurement days are counted per day, not per reading. A patient who takes blood pressure and weight on the same day has recorded one day, not two. If your day counter increments per device or per reading, it will overstate every patient’s count and your claims will not survive review.

Data must be transmitted digitally. A reading the patient types into a form does not count towards either device code. This is the single most common reason a cheap build turns out to be unbillable.

One practitioner per patient per calendar month may bill the management codes, and 99470 and 99457 cannot both be claimed in the same month.

The device has to be FDA-cleared and meet the FDA’s definition of a medical device.

One more condition sits outside the software and affects enrolment directly. Medicare covers 80% of these services, which leaves the patient responsible for the remaining 20% unless they hold secondary cover. That coinsurance is a live reason patients decline to enrol or drop out later, and a programme forecast built without it will overstate both enrolment and retention.

Rates vary by locality, and the two figures above are national averages drawn from published analysis of the final rule rather than from a fee schedule lookup. Before you build a financial model on them, check your own locality in the CMS Physician Fee Schedule lookup tool.

Core Features of Remote Patient Monitoring Software

The feature list is the part most people arrive with, so I will keep it brief and mark the items that carry hidden work.

The RPM Features Buyers Ask For

  • Device ingestion — readings arriving from cuffs, scales, glucometers and oximeters
  • Patient app or messaging layer — depending on the population, see the section below
  • Clinician dashboard — current readings, trends, and who needs attention today
  • Threshold alerting — rules per patient, not per condition
  • Escalation and task routing — what happens when an alert fires, and who owns it
  • Clinical time tracking — logged against the patient, auditable
  • Interaction logging — evidence of the real-time communication the management codes require
  • Billing-readiness reporting — day counts and minute totals per patient per cycle
  • Consent capture — RPM requires patient consent, recorded

The RPM Features That Decide Whether You Can Bill

The last three are the ones that separate a product from a demo, and they are almost never in the original brief. A clinician dashboard is table stakes. A report that tells a billing team exactly which patients crossed which threshold this cycle is the thing the practice actually runs on.

Threshold alerting deserves a specific warning. Alert rules set by condition rather than by patient produce alarm fatigue within weeks, and a clinical team that has learned to ignore alerts is worse than no alerting at all. Our breakdown of telemedicine app features covers the adjacent patient-facing pieces.

Remote Patient Monitoring Devices: Sourcing, Clearance, and Logistics

This is the part of an RPM programme that surprises people, because it is not a software problem and it does not go away.

Someone has to buy the cuffs and scales, confirm they are FDA-cleared, get them to patients, replace them when they break, and take them back when a patient leaves the programme. That is a logistics operation, and it has a cost per patient that runs alongside your build.

Cellular vs Bluetooth RPM Devices

Cellular or Bluetooth is the decision that shapes everything else. A Bluetooth device pairs with the patient’s phone, which means your patient app is now load-bearing infrastructure — if the app is closed, or the phone updated overnight, or the pairing dropped, the reading does not arrive and your day count does not increment.

A cellular device has its own modem and transmits on its own. There is no app, no pairing, and no phone. It costs more per unit and carries a data plan, and for the populations most RPM programmes serve, it is usually the right answer.

I have watched teams pick Bluetooth to save on hardware, then spend more than the saving on support tickets about pairing.

FDA Clearance: What Counts as an RPM Medical Device

Clearance is not optional. The device has to meet the FDA’s definition of a medical device and be cleared for the measurement it takes. A consumer wearable that estimates blood pressure is not the same thing as a cleared cuff, whatever the marketing says. If you are working with wearables more broadly, that sits closer to our wearable and IoT development work than to a clinical RPM programme.

RPM Device Logistics and the Return Path

Plan for the return path. Patients graduate, disenroll, or stop responding. Devices that never come back are a line in the budget whether or not you planned for one.

EHR Integration for a Remote Patient Monitoring Platform

A stream of vitals that lives only in your platform creates a second record, and the clinical team will trust the one they already use.

Most programmes need readings, or at least summaries and alerts, to land in the electronic health record. The work is the same shape as any clinical integration: an interface per system, vendor sandbox access, certification where the vendor requires it, and testing that takes longer than the build.

Two things are specific to RPM. The data volume is much higher than a typical clinical integration, because you are writing readings continuously rather than at a visit, so most programmes write summaries and exceptions rather than every measurement. And the billing evidence — day counts, logged minutes — usually has to reach the practice management system rather than the clinical record.

We covered the mechanics, timelines and vendor differences in EHR integration cost and timelines, and the same sequencing applies here.

Patient Adherence: Designing RPM Software People Will Actually Use

The population an RPM programme monitors skews older, sicker and less comfortable with smartphones than the population most product teams design for. A build that assumes daily app engagement produces a programme with no readings, and a programme with no readings has no billable days.

Why RPM Enrolment Fails

The research on this is blunt. A Mayo Clinic team in Rochester ran four RPM pilots for hospitalised patients and reported the outcomes honestly: enrolment ranged from 91 patients over five months in one programme to zero in another, which was discontinued before a single patient joined.

Their stated lesson is one I would put in front of every client before a line of code gets written. Adoption improved considerably when the enrolment conversation happened in person, as part of the discharge discussion, rather than being handled remotely afterwards.

That is an operational finding with direct product consequences. If enrolment happens at the bedside, your onboarding flow is a staff-facing tool, not a patient-facing one, and it needs to work in under two minutes on a ward.

A 2026 qualitative study in the Journal of Patient Experience by Matthew D. Dalstrom, Sherri Jordan, Colleen J. Klein and Melinda Cooling examined a Medicaid RPM programme for patients managing diabetes and hypertension. That programme communicated primarily through automated SMS and voice calls tailored to patient preference, with round-the-clock access to nurses through a central call center.

No app in the primary path. Text messages and phone calls, plus a cellular device that transmits on its own.

When to Skip the Patient App in an RPM Build

The uncomfortable recommendation: For a lot of RPM programmes, the right first build is a clinician platform plus a cellular device plus SMS, with no patient app at all. It costs less, it enrols better, and it produces more billable days. You can add the app later for the cohort that wants one.

That advice loses me revenue on the mobile side of a project, and I give it anyway, because a patient app that nobody opens is the most expensive way to fail at this.

HIPAA and FDA Requirements for Remote Patient Monitoring Software

Two regulatory questions, and they are commonly confused.

HIPAA applies because you are handling protected health information from the first reading. That means encryption in transit and at rest, role-based access, audit logging of every record view, a signed business associate agreement with every vendor touching the data, and test environments that hold no real patient data. Our guide to HIPAA-compliant app development sets out what those controls cost and where the effort lands.

FDA applies to the device, and sometimes to your software. A cleared cuff is the vendor’s responsibility. Your platform is usually not a regulated device while it displays, stores and transmits readings.

The line moves when your software starts interpreting. Software that analyses readings and tells a clinician what is wrong, or drives a treatment decision on its own, can fall under software-as-a-medical-device rules, which is a different regulatory path with a different timeline and cost.

This matters most for teams planning to add predictive alerting later. A threshold rule that fires when systolic pressure crosses a number set by a clinician is one thing. A model that predicts deterioration is another. Decide which one you are building before you build it, because retrofitting a regulatory pathway is far more expensive than planning for one.

Remote Patient Monitoring App Development Cost in 2026

Here is what these builds run by scope.

Scope What it includes Cost Timeline
Pilot programme Clinician dashboard, one device type, threshold alerts, manual billing report $60,000 – $110,000 3–5 months
Production clinic programme Above plus multiple device types, automated day and minute tracking, escalation workflows, EHR summary write-back $110,000 – $200,000 5–8 months
Multi-site or enterprise Above plus multi-tenant structure, role-based administration, two-way EHR sync, reporting across locations $200,000 – $400,000+ 8–14 months

These sit inside our published healthcare app development cost range for the wider category.

What Moves an RPM Development Quote

What moves a quote, in order of impact:

Device breadth. Each device type is its own ingestion path with its own testing. One cuff is a fraction of the work of five device types across three manufacturers.

Billing evidence. Automated day-counting, minute tracking and interaction logging that survives an audit is real engineering. Teams that treat it as a report at the end pay for it twice.

Integration depth. Summary write-back into an EHR is modest. Two-way sync is the largest single step in the table.

RPM Costs That Sit Outside the Build

Three costs sit outside the build and belong in the same conversation: the devices themselves, the data plans if you go cellular, and the clinical staff time the programme consumes every month.

Want to see where your scope lands?

Run it through our cost calculator for a range you can take to a board, or talk it through with someone who has priced these programmes before.

Estimate the cost of your scope

Remote Patient Monitoring Software Development Timeline, Phase by Phase

Phase Duration What happens
Discovery and billing design 3–5 weeks Which codes you intend to bill, what evidence each requires, how the platform will produce it
Device selection and procurement 2–6 weeks, overlapping Clearance checks, cellular or Bluetooth, supplier terms, logistics
Design 3–4 weeks Clinician dashboard first, patient-facing layer second
Core build 10–16 weeks Ingestion, alerting, escalation, time and day tracking
EHR integration 4–10 weeks, overlapping Sandbox access, interface build, certification where required
HIPAA review and testing 2–4 weeks Controls, audit logging, penetration testing
Pilot 6–12 weeks One clinic, one condition, one device type

Putting billing design in the first phase rather than the last is the single change I would make to how most of these projects run. The codes decide the data model. Working out in month six that your day counter increments per reading rather than per day means rebuilding the thing the whole programme depends on.

Pilot with one condition and one device type. Adherence, alert volumes and staff workload all behave differently from the forecast, and finding that out across one cohort is far cheaper than across five.

Build, Buy, or White-Label Remote Patient Monitoring Software

Route What you get Cost shape Best when
Buy an RPM platform Devices, software and billing reports as a package, usually per enrolled patient per month Recurring fee, minimal upfront You are running a standard programme and want revenue this quarter
White-label a platform An existing platform under your brand, with some configuration Licence plus setup, typically $30,000 – $90,000 of integration work You need your own branding and workflows but not your own product
Build Full control of the data, the clinical logic and the patient experience See the cost table above RPM is your product, or your clinical model does not fit what is on the market

What Is the Best Software for Remote Patient Monitoring

Most practices should buy. If you run a clinic and want to start monitoring hypertensive patients next quarter, a platform with devices included will get you there faster and cheaper than anything I could build you.

When Building Custom RPM Software Is Worth It

Building earns its money in three situations. You are a digital health company and the monitoring platform is the product you sell. Your clinical model does something existing platforms do not support. Or you need the physiologic data inside your own systems for research, risk modelling or a payer contract, and no vendor will give you that access on acceptable terms.

That honest split is why our healthcare app development services conversations often start by mapping which of the three a client is actually in.

When Readings Stop: Handling Missing Data in an RPM Programme

Missing data is the normal operating state of an RPM programme, and almost nothing published about building these systems addresses it.

A patient stops transmitting. The device battery dies, they travel, they go into hospital, or they simply lose interest in week three. Your platform has to notice, decide whether it matters clinically, and get someone to act, before the 30-day cycle closes and the billable day count falls short.

That produces three requirements almost nobody specs at the start.

Three RPM Platform Requirements Nobody Specs at the Start

A silence detector. Alerting on bad readings is obvious. Alerting on the absence of readings is the one that protects both the patient and the revenue.

A cycle-aware nudge. The system should know that a patient is on day 22 with nine transmitted days, and prompt outreach while there is still time to reach the threshold. This is exactly where the new 2026 code helps, because reaching 15 days now means a billable month rather than a written-off one.

A workload view. Someone has to make the outreach calls. If the platform cannot tell a care coordinator which twelve patients to chase today, that work does not happen.

I would build the silence detector before I built half the features that usually make it into version one.

The RPM Break-Even Model: Will Your Programme Pay Back?

Whether a programme pays back comes down to four numbers, and they can be worked out on one page before anyone commissions a build.

The Four Inputs to an RPM Break-Even Calculation

  1. Enrolled patients. Not eligible patients. Enrolled and consented. Realistic enrolment is a fraction of eligibility, and the Mayo pilots are a reminder that the fraction is sometimes zero.
  2. Billable-month rate. Of your enrolled patients, what share produce a billable month? A patient reaching 16 days claims the higher device code; one reaching 2 to 15 days now claims the new short-window code. Under the pre-2026 rules everyone below 16 produced nothing, so any model built on older guidance understates this.
  3. Revenue per billable month. The device code plus whichever management code the clinical time reaches. Pull the exact figures for your locality from the CMS Physician Fee Schedule lookup tool rather than any published average, including the ones in this article.
  4. Monthly cost to run it. Clinical staff time, devices, data plans, platform hosting. This is where programmes that look profitable on a spreadsheet stop being profitable in practice.
Input Where it comes from
Enrolled patients Your own enrolment forecast, discounted
Billable-month rate Adherence assumption, tested in the pilot
Revenue per billable month CMS PFS lookup for your locality
Monthly running cost Staff hours, device amortisation, data plans, hosting
Build cost The cost table above

How to Use the RPM Break-Even Model

Multiply the first three for monthly revenue, subtract the fourth, and divide the build cost by what remains. That is your payback in months.

The number that surprises people is the second one. Teams model at 90% and reality lands far lower, particularly in the first quarter while enrolment and habits settle. Model at a rate you would be disappointed by, and if it still works, build it.

What I tell clients to do with this: Run the model twice. Once with the adherence you hope for, once with half of it. If only the optimistic version closes, the answer is to buy a platform and prove the programme first, then build once you have real numbers instead of assumptions.

Conclusion

The 2026 rule change makes remote patient monitoring work for a wider set of patients than it did a year ago, and most of what is written about building these systems still describes the old rules.

That creates an opening and a trap. The opening is that months you used to write off are now billable. The trap is that capturing them depends on a platform that counts days correctly, distinguishes between two device codes, tracks clinical time against the right threshold, and can evidence all of it.

Before commissioning anything, work through the break-even model with an adherence number you would be unhappy with. If it closes, you have a programme worth building software for. If it only closes on optimism, buy a platform, run it for two quarters, and come back with real numbers.

Build a remote patient monitoring platform that can evidence its own billing

Device ingestion, clinical workflows, EHR integration and HIPAA-ready architecture for clinics, health systems and digital health companies. See how we scope it, what it costs, and how long it takes.


Explore our healthcare app development services →

Doctor Appointment Booking App Development: What It Takes and What It Costs in 2026

Doctor appointment booking app development means building the system a clinic uses to publish its availability, let patients claim a slot, and keep that slot in sync with the practice management system and the EHR behind it.

I have scoped a lot of these. The conversation almost always opens with a feature list, and the feature list is almost always the least interesting part.

What decides whether one of these apps works is a set of choices nobody puts in the brief: whether patients can move their own appointments, how you stop two people taking one slot, and what happens when the schedule changes in the EHR rather than in your app.

This guide covers the features, the integration work, HIPAA, what it costs, how long it takes, and the one architectural decision I would make first.

The most expensive mistake I see is building a booking app that cannot release a slot. If a patient has to phone the clinic to cancel, most will just not turn up, and the slot dies with them.

Key Takeaways

  • A doctor appointment booking app costs roughly $45,000 to $140,000 for a clinic-scale build, and $140,000 to $250,000 once it syncs both ways with an EHR.
  • Letting patients cancel and rebook themselves is the decision that moves the numbers most. In a 2025 study, direct booking produced a 8% no-show rate against 5.9% for phone bookings.
  • The same study found the opposite result at a hospital using a request-and-triage form, where online bookings ran 3% against 11.2%. The booking model drives the outcome, not the fact that it is online.
  • The hardest engineering is slot locking and capacity, and it rarely appears on a feature list.
  • Two-way EHR integration usually costs more than the booking app itself.
  • Reminders help and then flatten out. A meta-analysis of 26 studies found reminded patients were 23% more likely to attend.

What a Doctor Appointment Booking App Has to Do

Strip it back and the job is small. Show real availability, take a booking, and hold it.

Then let that booking be moved or released, and tell the clinical system what happened.

Everything else is a feature on top of those five.

They get complicated because availability is not a simple calendar. A provider has appointment types of different lengths, rooms and equipment that can only be used once at a time, buffers between patients, and rules about who may book what.

Most failed booking projects I have seen failed at that layer, long before anyone reached telemedicine app development or the AI triage behind modern medical diagnosis apps.

Direct Booking or Request-and-Triage: The Decision That Sets Your No-Show Rate

There are two ways to build the booking flow, and they produce measurably different results.

Direct booking. The patient sees live slots, picks one, and owns it. They can cancel or move it themselves, at any hour, without speaking to anyone.

Request and triage. The patient submits a request. Staff review it, decide urgency, and assign a slot. Changes go through the same queue.

The evidence here is unusually clean. A 2025 study in *Frontiers in Digital Health* tracked 98,067 appointments across an ophthalmology practice and a university hospital over twenty months.

In the practice, which used direct booking, online appointments had a no-show rate of 1.8% against 5.9% for phone bookings. Unused slots fell from 22.7% to 10.3%, and slots never booked at all fell from 8.6% to 1.6%.

In the hospital, which used a request form with internal triage, online appointments performed worse than offline ones, at 14.3% against 11.2%.

Same channel. Opposite outcome.

The authors are direct about why. Practice patients typically cancelled or rebooked 24 to 48 hours ahead, giving staff time to refill the slot. Hospital patients could not, because every change went back through triage.

The rule I take from this: Being online does nothing on its own. What lowers no-shows is handing the patient control of their own appointment. If your build ships without self-service cancellation, you have built a request form with a nicer interface.

Dr. Michael Reich, the study’s senior author, is an ophthalmologist at Augenärzte am Städel in Frankfurt and at the Eye Center of the Medical Center–University of Freiburg. His team concluded that the benefit depends on the setting and on how much autonomy the system gives the patient. There is a real exception. Some care needs triage: complex referrals, specialist sequencing, anything where the wrong slot is a clinical risk. If that is your situation, build the triage queue properly and put your effort into reminders instead.

Why Reminders Alone Will Not Fix Your No-Show Rate

Reminders work. They also stop working sooner than people expect.

A systematic review of 26 studies published in *BMJ Open* found that patients who received a digital reminder were 23% more likely to attend. In the Frontiers study, SMS reminders measurably reduced no-show risk in the hospital setting. But a study of ten American clinics found centralized telephone reminders moved the no-show rate from 16.3% to 15.8%. That is a rounding error.

The pattern is consistent. A reminder acts on an appointment that already exists, so it cannot change how hard that appointment was to book, how easy it is to move, or how long the patient waited for it. A systematic review of 105 studies in *Health Policy* put the average no-show rate across specialties at 23%, and found longer waits between booking and appointment among the strongest predictors of a missed visit.

Build reminders properly, with two-way responses so a cancellation actually frees the slot. Then accept that the booking pathway does the heavier work.

Core Features of a Doctor Appointment Booking App

This is the part most feature lists get right, so I will keep it short and flag the ones that carry hidden work.

  • Provider availability rules — appointment types, durations, buffers, room and equipment constraints
  • Patient-facing slot search — by provider, specialty, location, and soonest available
  • Self-service cancel and reschedule — the feature from the section above
  • Two-way SMS and push reminders — a reply must actually release the slot
  • Waitlist and auto-fill — offers a freed slot to the next patient automatically
  • Intake forms — collected before the visit, not in the waiting room
  • Payments and copay collection — card on file changes attendance behaviour
  • Provider and admin dashboard — the schedule as staff actually work it
  • Patient record and visit history

Two are more work than they look. Waitlist auto-fill is a real-time matching problem, and intake forms touch protected health information the moment a patient types into them.

If video visits are in scope, the telemedicine app features breakdown covers that side, and healthcare app development covers where booking sits among the other modules.

The Hard Part: Slot Locking, Capacity and Double-Booking

Here is the problem that eats timelines.

Two patients open the same slot at the same moment. Both tap book. Without the right handling, both succeed, and a receptionist finds out on the morning of the appointment.

The fix is a short-lived lock. When a patient opens a slot you reserve it for a few minutes, then release it automatically if they abandon. The lock has to survive a crash, a lost connection, and a patient who leaves the screen open for an hour.

Capacity is harder. A clinic’s real capacity is doctors, rooms, equipment and support staff, all of which can block each other, and a slot is only bookable when every resource it needs is free.

Elizabeth W. Woodcock’s 2022 scoping review in the *Journal of Medical Internet Research* on automated patient self-scheduling found that organizational and workflow barriers, rather than technology, are what usually stop these systems working.

That matches what I see. The code is tractable, and getting a clinic to agree on its own booking rules is the slow part.

Budget real discovery time for those rules. Every clinic thinks theirs are simple until you write them down.

EHR and Practice Management Integration

A booking app that does not write back into the clinical system creates a second source of truth, and the clinic will trust the old one.

Three levels, roughly:

Read-only. Your app pulls availability and displays it. Staff still enter the booking. Cheapest, and it keeps a manual step.

One-way write. Your app pushes confirmed bookings into the EHR or practice management system. Most clinic builds land here.

Two-way sync. Changes in either system reflect in the other. Most of the value sits here, and most of the cost.

Integration usually costs more than the booking app itself, especially with larger vendors where certification and sandbox access add weeks before anyone writes code. We covered EHR integration cost and timelines separately.

If patient communication and follow-up are also in scope, that overlaps with healthcare CRM territory and is worth scoping at the same time.

HIPAA and What It Adds to the Build

The moment your app knows that a named person has an appointment with a named doctor, you are handling protected health information.

That brings requirements: encryption in transit and at rest, access controls with real roles, audit logging of every record view, a signed agreement with every vendor that touches the data, and a breach process you can actually run.

Practically, it affects your build in four places. Your hosting has to support a signed business associate agreement, and your logging has to capture reads as well as writes.

Your SMS reminders cannot contain clinical detail, and your test environments cannot hold real patient data.

None of this is exotic. It does add time, and the teams that get caught out are the ones who treat it as a security review at the end. Our guide to HIPAA-compliant app development sets out what the controls cost and where the effort lands.

Doctor Appointment Booking App Development Cost

Here is what these builds actually run, by scope.

Scope What you get Cost Timeline
Single-clinic MVP Slot search, booking, self-service cancel, SMS reminders, admin dashboard. No EHR write-back. $45,000 – $80,000 3–4 months
Multi-provider clinic Above plus capacity rules, waitlist auto-fill, intake forms, payments, one-way EHR write $80,000 – $140,000 4–6 months
Group or multi-location Above plus two-way EHR sync, multi-site availability, role-based admin, reporting $140,000 – $250,000 6–9 months
Patient-facing platform Multi-clinic marketplace, provider onboarding, telehealth, billing $250,000+ 9 months+

These sit inside our published healthcare app development cost range of $30,000 to $500,000 and higher, which covers the wider category.

Three things move a quote more than anything else. How many outside systems you connect to, since each is its own piece of work with its own testing. Whether you need two-way sync, which is the largest single step in this table.

And how complicated your availability rules are. A single-specialty clinic with one room type is a different build from a group practice with shared imaging equipment.

 What would your version cost?

Run your scope through our cost calculator for a range you can put in front of a partner meeting, or talk it through with someone who has priced these builds before.

Estimate the cost of your scope

Development Timeline, Phase by Phase

Phase Duration What happens
Discovery and booking rules 2–4 weeks Documenting availability, appointment types, resource constraints
Design 3–4 weeks Patient booking flow and staff dashboard
Core build 8–12 weeks Booking engine, slot locking, notifications, admin
Integration 4–10 weeks, overlapping EHR and practice management connection, sandbox access, certification
HIPAA review and testing 2–4 weeks Controls, audit logging, penetration testing
Pilot and rollout 3–6 weeks One clinic or one specialty first, then widen

Integration is the phase that slips, and it slips on access rather than engineering. Request vendor sandbox credentials during discovery, not when you are ready to build against them.

Pilot with one clinic. Booking rules that looked complete on paper show their gaps in the first fortnight of real use, and fixing them across one site is far cheaper than across nine.

Build, Buy, or Configure: Three Routes Compared

Route What you get Cost Best when
Buy a scheduling product Fast, supported, standard flows Per-provider subscription Your workflows are close to standard and you have no product ambition
Configure a platform A commercial scheduling tool extended and integrated to fit Licence plus $30,000 – $90,000 of engineering You want speed, but the standard flows miss your specialty
Build Full control of the booking logic, the data, and the patient experience See the cost table above Booking is part of your product, or no product handles your availability model

I talk more clients out of building than into it. If you run one clinic with standard appointment types, a commercial product configured properly will serve you better for a fraction of the cost.

Building earns its money in three situations: your availability rules break standard products, the booking experience is part of what you sell, or you need the appointment data in your own systems. That work sits in our healthcare app development services.

What We Learned Building Booking at Scale

The clearest lesson I have on capacity came from outside healthcare.

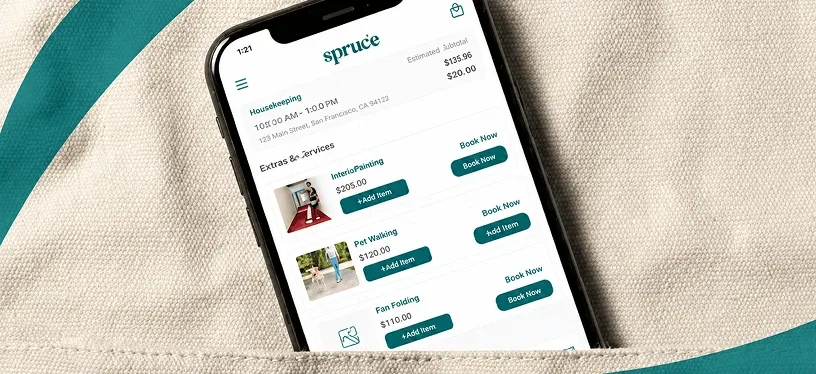
Spruce runs home and property services across the United States. Residents, property managers and short-term rental operators all book cleaning and chore visits through the same platform, and service professionals work those bookings in the field.

Their legacy system had no capacity management. Bookings went in faster than the workforce could absorb, which meant overbooking, uneven workloads, and service pros stacked against each other.

We rebuilt the platform across every role and added a capacity management module that balanced workload against actual available resources, a mobile app so service pros could manage tasks and availability in real time, and a pricing configurator that adjusted by region and property.

The platform now runs 6,477 properties and more than 685,000 customers, with 67 service providers and 7,581 property management companies on it.

Change the words and that is a clinic. A slot is only real if the person and the room are both free, and fixing that needed a module of its own rather than a setting.

We have seen the same shape in wellness, on a platform where treatment rooms had to be cleaned and reset between clients, so two bookings that looked compatible on a calendar were not compatible in the building.

How to Scope This Without Overbuilding

Five things I would settle before anyone writes code.

  1. Decide the booking model first. Direct booking or request-and-triage. It changes the product, the integration and the outcome.
  2. Write down your availability rules. All of them, including the ones staff hold in their heads. This is the single best predictor of whether the estimate holds.
  3. Count your integrations and price them one by one. Never price one and assume the rest are free.
  4. Decide what happens to a freed slot. If the answer is “nothing”, cancellation is not saving you anything.
  5. Pick the pilot clinic before you start. It changes what you build first.

The version that works is usually smaller than the one people arrive with. Slot search, real self-service cancellation, working reminders and one solid integration will beat a feature-rich app that staff quietly stop using.

Conclusion

Most of the value in a doctor appointment booking app comes from two decisions: whether patients control their own appointments, and whether your schedule stays true to the clinical system behind it.

Get those right and a modest build will fill slots and cut no-shows. Get them wrong and staff will quietly keep the old process running alongside the new one.

If you are weighing a build against a commercial product, write down your availability rules and see whether anything on the market handles them. That answers the question faster than any demo will.

Build a booking system your clinic will actually use

Booking engines, EHR integration, and HIPAA-ready builds for clinics, groups and health-tech teams. See how we scope it, what it costs, and how long it takes.


Explore our healthcare app development services →

EHR Implementation Cost in 2026: What Practices, Clinics, and Hospitals Actually Pay

EHR implementation cost runs from roughly $15,000 to $70,000 per provider, the band the ONC has long cited for a certified commercial system. What an organization actually spends sits anywhere around that figure. A three-provider clinic configuring a cloud EHR as shipped can land near $45,000 in year one. A fifty-provider group adding custom integrations to Epic or Oracle Health passes $500,000. A hospital replacing a legacy system reaches seven figures.

Those ranges describe different things. Each answers a different question about four variables: the unit being counted, where the scope boundary falls, how long the window runs, and which build path the organization takes.

This guide gives the line-item breakdown, the five-year comparison of cloud against on-premise, the costs that land after go-live, the annual maintenance figure, and a framework for identifying which published number describes an organization like yours.

The number that breaks budgets is rarely the license. In the scoping calls I sit in, the software line is the one people have already researched. The lines that move the total are data migration, interface work, and the weeks of lost productivity nobody put in the spreadsheet.

 Key Takeaways

  • The ONC band for a certified commercial EHR is $15,000 to $70,000 per provider, and it covers the system only. Implementation, data migration, and training sit outside it.
  • Published EHR cost figures look like they contradict each other because they answer different questions. Four variables explain the gap: the unit counted, the scope boundary, the time window, and the build path.
  • Cloud costs less upfront and more across five years. Roughly $26,000 upfront and $58,000 at five years, against $33,000 and $48,000 for on-premise.
  • Go-live costs revenue before it saves any. Physician productivity drops for the first three to six months after a cutover, and that lost revenue appears on no vendor quote.
  • Annual maintenance runs 15% to 20% of initial implementation cost for a vendor-supported system, every year, for the life of the system.
  • The line vendor quotes leave out is the configuration, integration, and workflow engineering that makes the system fit how your teams already work.

How Much Does EHR Implementation Cost in 2026?

A single provider should plan for $15,000 to $70,000 for a certified commercial EHR, before implementation services. A solo practice usually lands between $15,000 and $35,000 in year one. A three-to-ten provider clinic runs $45,000 to $180,000. A ten-to-fifty provider group runs $180,000 to $600,000. A hospital replacing a core system runs into seven or eight figures.

That spread reflects four genuinely different buying situations.

Here is the shape of it by organization type.

Organization Year-one total Per provider What drives the spread
Solo practice (1 provider, 2–3 seats) $15,000 – $35,000 $15,000–$70,000 (ONC) Seat count, cloud or on-premise
3–10 providers $45,000 – $180,000 $15,000–$70,000 (ONC) Data migration volume, number of interfaces
10–50 providers $180,000 – $600,000 $15,000–$70,000 (ONC) Specialty configuration, three or more interfaces
Hospital / health system Seven to eight figures Vendor certification, bed count, internal IT queue

Two things about that table matter more than the numbers in it. The per-provider column and the year-one column measure different things, which is why a quote built from one will not match a budget built from the other. And the hospital row carries no dollar figure on purpose, because “hospital” covers a 40-bed rural facility and a 600-bed system in the same word.

Why EHR Cost Figures Disagree With Each Other

Research a number for this and you will find several, all credible, all different. The ONC puts a certified system at $15,000 to $70,000 per provider. A widely cited 2011 Health Affairs study put a typical multi-physician practice at about $162,000 to implement, with $85,500 in first-year maintenance. It predates cloud deployment becoming the default, which matters when you read it. The Michigan Center for Effective IT Adoption puts a cloud deployment at $26,000 upfront.

None of those is wrong. They answer different questions.

The ONC figure counts one provider and one system. The Health Affairs figure counts a whole practice and includes the work of getting live. The Michigan figure counts upfront spend on one deployment model.

Put them side by side without labels and they read as a contradiction. Label them and they line up.

The labelling problem, in one line: A user seat and a provider are not the same unit. A seat covers front desk and billing staff too. For a practice with three physicians and four support staff, the same system can honestly be quoted as a per-user figure in the low thousands or a practice total in the tens of thousands. Both numbers are true. Only one of them is your budget.

Ask every number the same four questions and the confusion clears.

The Four-Variable EHR Implementation Cost Framework

Every EHR cost figure you encounter sits somewhere on four axes. Find its position and you know whether it applies to you.

Variable The question it answers Why figures diverge on it
1. Unit Per user, per provider, per bed, or total program? A user seat includes admin and support staff. A provider does not. The same system reads very differently depending on which you count.
2. Scope boundary License only, license plus implementation, or full cost of ownership including lost productivity? This one variable explains most of the gap between a five-figure and a six-figure practice number.
3. Time window Upfront, year one, or five-year total? Cloud looks cheaper upfront and more expensive at five years. Quoting one window without naming it makes any comparison meaningless.
4. Path Buy as shipped, configure and integrate, or build? The path explains the jump from five figures to seven. It is also the variable most quotes stay silent on.

Use it on your own quotes. When a vendor sends a number, write the four answers next to it before comparing it to anything. Two quotes that look $40,000 apart are often the same quote with different boundaries drawn around it. We apply the same structure in how software projects are estimated across every vertical we work in.

EHR Implementation Cost Breakdown by Line Item

A complete EHR implementation budget has nine lines. Most quotes cover three of them.

Line item What it covers Who charges it Usually negotiable?
Software license or subscription The system itself, per seat or per provider Vendor Rarely
Hardware and network Servers, workstations, scanners, bandwidth Third party Yes — audit what you already own
Implementation and configuration Setup, templates, workflows, permissions Vendor or partner Often
Data migration Moving records from the old system or paper Vendor or partner Sometimes
Interfaces Connections to labs, pharmacy, imaging, billing Vendor or partner Per interface
Staff training Initial sessions plus new-hire training later Vendor or in-house Yes — a superuser model cuts this
Go-live support On-site help during the cutover weeks Vendor or partner Sometimes
Annual maintenance Support, updates, security patches Vendor Rarely
Contingency The reserve for what you did not predict You Not a line to cut

Two notes from the scoping side.

Hardware is the line people over-buy. If your existing workstations run fine and your network holds, a cloud deployment may need very little new equipment. Audit before you order.

Interfaces are the line people under-buy. Each connection to a lab, pharmacy, or billing platform is its own piece of work with its own testing. Pricing one and assuming the rest are free is the most common budgeting error I see, which is why we covered EHR integration cost and timelines separately.

Data migration deserves its own conversation with whoever holds your current records. Moving structured data from a modern system is very different work from abstracting paper charts, and the same healthcare data integration questions apply. Where a customer relationship system is also in scope, our healthcare CRM guide covers that budget.

EHR and EMR Costs by Organization Size: Solo Practice to Hospital

People use EHR and EMR interchangeably, and for budgeting purposes they should. An EMR is usually one practice’s digital chart. An EHR is built to be shared across organizations. The pricing models, the implementation work, and the annual cost behave the same way, so compare an EMR quote and an EHR quote line for line without adjusting anything.

Solo practice. Cloud, configured as shipped, minimal interfaces. Budget the license, training, and getting old records in. Custom work here is usually the wrong spend.

Three to ten providers. Interfaces start to matter. A lab connection, a billing connection, and e-prescribing turn a simple rollout into a project.

Ten to fifty providers. Specialty workflow becomes the cost driver. Behavioral health, orthopedics, oncology, and correctional health commonly need documentation and reporting the system does not ship with. The same is true in dentistry, which is why dental EHR systems are priced differently from general practice.

Hospital and health system. Vendor certification, internal IT scheduling, and the number of departments involved set the pace and the price. The engineering is rarely the long pole.

Cloud vs On-Premise EHR Cost: The Five-Year Comparison

Cloud costs less to start and more to keep. On-premise costs more to start and less to run. The crossover usually lands somewhere in year three or four.

Deployment Upfront Annual Five-year total
Cloud EHR $26,000 $8,000 $58,000
On-premise EHR $33,000 $4,000 $48,000

Source: Michigan Center for Effective IT Adoption, published via HealthIT.gov.

Run the arithmetic on that table and the lines cross at roughly year two to three, after which on-premise pulls ahead on paper. That crossover point is the number I would want in front of me before choosing a deployment model.

On-premise also means you own the server refresh, the backups, the security patching, and the staff who do all three. Those costs are real and they sit outside the table. For most practices under about twenty providers, cloud remains the better call even at year five.

What decides it is how long you expect to keep the system. Budget over three years and cloud wins comfortably. Budget over eight and the question is open.

The EHR Implementation Costs That Land After You Sign

Some costs arrive after the contract. They are the ones that turn a funded project into an awkward board conversation.

Lost productivity during go-live. Physicians see fewer patients for the first three to six months while they rebuild their documentation habits around a new system. That is revenue leaving the building while you are still paying for the system.

Do this arithmetic before you sign: Take one physician’s annual collections. Decide how far their volume will fall and for how long, then multiply the two. That is your per-physician revenue cost of go-live. Multiply by headcount. Ask your vendor what dip comparable clients saw and hold them to the answer. For most groups the number lands in the same order of magnitude as the software itself, and it appears on no quote anywhere.

Training you will need twice. The initial sessions are usually quoted. The training you run six months later, for people who joined after go-live and staff who never fully got there, usually is not.

Interface changes you did not cause. When a lab or clearinghouse changes its API, someone has to fix your side. Settle in the contract who that someone is.

Compliance work. HIPAA controls, audit logging, access reviews, and the agreements required with every vendor touching patient data all carry cost. We cover how HIPAA compliance adds to the build budget in more depth.

Exit terms. Ask what it costs to get your data out before you sign the contract to put it in. Extraction fees are easier to negotiate while you are still a prospect.

EHR Implementation Timeline: When Each Cost Actually Hits

Cost and schedule are the same conversation. Here is the sequence and where the money lands in it.

Phase Typical duration What you are paying for Fixed or variable
1. Selection and RFP 4–12 weeks Internal time, occasionally an advisor Variable
2. Contracting 2–6 weeks Legal review, security review Mostly fixed
3. Configuration and build 6–16 weeks Implementation fees, interface work Variable — the big one
4. Data migration 4–10 weeks, overlapping Migration services, validation time Variable
5. Training and go-live 2–6 weeks Training, on-site support, temporary staffing Fixed, plus lost revenue
6. Stabilization 4–12 weeks Fixes, optimization, retraining Variable

Phase three is where budgets move, and it is where waiting happens. Vendor approvals, sandbox access, and certification queues sit outside anyone’s control. Muhammad Arif, one of our technical project managers, puts the external approval window at four to twelve weeks on the integration side, and that pattern holds on full implementations. His reasoning is in our EHR integration services guide.

Register for vendor sandbox access on day one of phase two. It is the cheapest schedule saving available and almost nobody does it early.

Buy, Configure, or Build: What Each EHR Path Costs

This is the variable that moves the total more than any other, and the one that gets the least attention during selection.

Path What you get Relative cost Timeline Best when
Buy and use as shipped A certified system, vendor templates, standard interfaces Lowest 3–6 months Your workflows are close to standard and the specialty is well served
Buy, then configure and integrate The same system, reshaped around your workflows, connected to what you already run $50,000 – $200,000 above the license 5–10 months Specialty requirements, multiple systems, or an operations model the system does not anticipate
Build A system designed around your model from the start $200,000 – $500,000+ 12 months and up Your product is the record layer, or no certified system fits the care model

The middle path is where most real spend lands and where most planning does not. I would rather talk a client out of custom work than into it, and the strongest external voice on this agrees. Jonathan Manis, Senior Vice President and CIO at Christus Health, which runs more than 60 hospitals, has been blunt about it in Becker’s Hospital Review. Across well over 150 implementations at three large provider systems, he says he has yet to see a case where the organization did not end up regretting how many customizations it allowed.

He is right, and the useful question is where the line sits. The clearest rule I have seen is: target customizations that affect close to half your users and medical staff, and avoid building for a single user or small group, with narrow single-specialty areas as the exception.

My own version is simpler. Configuration that changes how a workflow runs for a whole department is usually worth paying for. Configuration that encodes one clinician’s preference is a maintenance liability you carry for years.

Where the middle path actually earns its money

The strongest case for engineering work is rarely inside the record system. It is in the workflows around it.

We worked with a dental and orthodontic group whose clinical records lived in one system while eligibility checks, claims, payment posting, and bank reconciliation lived across several others. Staff moved data between them by hand, every day.

The record system was fine. The gap between it and everything else was the expensive part. Claims waited on manual eligibility checks, and payments posted late because someone matched bank transactions against remittance files by hand. A different EHR would have fixed none of it.

What we built sat between those systems: automated eligibility verification ahead of appointments, automated remittance processing, and automated payment posting back into the practice management platform, with exceptions routed to a person instead of the whole queue.

That is the budget line I want people to plan for. Scoping the work around the record system is the core of our interoperability and system integration services.

Want a number you can take to the board?

Run your scope through our app cost calculator for a range you can defend, or talk it through with someone who has priced these builds before.

Estimate the cost of your EHR integration scope

EHR Maintenance Cost: What You Pay Every Year After Go-Live

Plan for 15% to 20% of your initial implementation cost, every year, for the life of the system.

That covers vendor support, software updates, security patching, and the smaller fixes that keep the thing running. It is a permanent operating line, not a tail on the project budget.

That band assumes a vendor-supported commercial system. Software you own outright runs closer to 15% to 25%, because every fix and dependency upgrade is yours.

Three things push it higher than people expect. Interfaces need maintenance of their own, because every connection you built is one somebody has to keep working when either end changes. Storage grows as imaging, documents, and audit logs accumulate, and cloud pricing follows them. Staff turnover costs training, since every new clinician needs onboarding into a system they have never used.

The first year usually runs above the steady-state percentage because you are still fixing configuration and training people who did not absorb it the first time. Budget year one higher and expect it to settle.

How to Control EHR Implementation Cost: A Pre-Contract Checklist

Most savings are available before signature and almost none after it. Work through this list.

  1. Write down every system the EHR must talk to. Count them. Price them individually. This single step prevents the most common overrun.
  2. Ask what is excluded, in writing. Get the quote to state what it does not cover rather than what it does.
  3. Separate configuration from customization. Configuration uses what the system already supports. Customization builds something new and carries it forever.
  4. Apply the half-your-users test. If a change does not help a large share of staff, it is probably not worth the maintenance.
  5. Model the revenue dip. Put it in the budget as a line with a number, not as a risk in a footnote.
  6. Hold a contingency reserve of 20%. Treat it as planned spend rather than an emergency fund. Make it 25% if you are replacing a system or connecting several at once.
  7. Negotiate exit terms up front. Data extraction costs and formats are far easier to settle before you sign.
  8. Start vendor approvals immediately. Waiting is the cheapest thing to fix and the most expensive to ignore.

The cheapest decision in the whole project: Inventory your interfaces during selection, before you shortlist. Teams that do this get accurate quotes and stay close to them. Teams that discover interfaces during phase three pay for each one at the point in the project where they have the least negotiating room.

On the return side, the case for the spend holds up. A Health Affairs study put payback for a typical practice at around two and a half years, with net benefit per full-time employee after that. Cleaner billing, fewer documentation errors, and less time chasing records are where it comes from.

Conclusion

The decision in front of you is which of these numbers describes your organization. That comes down to the four variables: how many people need a seat, where you draw the scope boundary, how far out you are budgeting, and whether the system will be used as it ships or reshaped to fit how your teams already work.

The first three you can settle in an afternoon with your own headcount and finance data. The fourth is the one that moves the number most, and it is the one vendor quotes stay silent on.

If you are trying to price the gap between what an EHR does out of the box and what your workflows actually require, that gap is worth scoping properly before it becomes a change order.

Scope the work your EHR quote does not cover

Configuration, integration, and workflow engineering on top of Epic, Oracle Health, athenahealth, and the rest. See how we scope it, what it costs, and how long it takes.


Explore our healthcare software development services

How to Build a Medical App: A Step-by-Step Guide

To build a medical app, you work through eight stages: define the workflow it replaces, map your data and who owns it, list every user role, choose your build approach, design for clinical use, build a compliant MVP, test against HIPAA and app store requirements, then launch and iterate.

The order matters more than the list. Some of these decisions are cheap to change later and some of them are not.

Adding a feature in month four costs a sprint. Discovering in month four that your app handles Protected Health Information (PHI — any health data that can be traced back to a person) and your cloud provider never signed a Business Associate Agreement costs a rebuild. Connecting to an electronic health record system after your data model is already set is a different project from designing for it on day one.

This guide walks the eight stages in order, and flags which decisions lock.

Key Takeaways

  • Building a medical app is a sequence of decisions, and four of them — data ownership, user roles, EHR integration and PHI custody — are expensive or impossible to reverse once development starts.
  • The number of distinct user roles drives scope more than the number of features, because every role is a separate interface, permission set and test surface.
  • A HIPAA-compliant platform does not make your app HIPAA compliant. The platform covers its own infrastructure; your workflows, access rules and vendor agreements stay yours.
  • No government body certifies software as HIPAA compliant, so any vendor claiming certification is using marketing language rather than a legal position.
  • Apple and Google apply health-specific review rules, and they are a common cause of launch delay.
  • If you cannot name the single workflow your app replaces and the person who performs it today, you are not ready to write a spec.

What Is a Medical App?

A medical app is software that supports the delivery, management or monitoring of healthcare. That covers a patient booking a video consultation, a nurse reviewing vitals from a home monitor, and a billing team clearing a claims queue. The shift in how mobile apps are changing healthcare delivery has been steady rather than sudden, and the telemedicine adoption data bears that out.

The distinction that decides your build is narrower than the category. If your app touches Protected Health Information, it falls under HIPAA and a specific set of obligations follow. If it collects step counts and sleep data with no link to a named patient or a care relationship, it is a wellness app and most of those obligations do not apply.

That line moves more of your budget than your feature list does. A wellness app and a patient app can look identical on screen and cost very different amounts to build, because one of them needs encrypted storage, role-based access, audit logging and signed vendor agreements behind it.

Work out which side of the line you are on before anything else. If you are unsure, assume you are handling PHI and design accordingly, because removing safeguards later is easy and adding them to a live system is not.

Types of Medical Apps You Can Build

Most projects fall into one of five groups. Knowing which one you are in tells you who your users are, which systems you will need to talk to, and how much regulatory weight the build carries.

Patient-facing care apps. Booking, video consultations, secure messaging, prescriptions, results. These carry the heaviest PHI load and the most app store scrutiny, because patients use them directly. Our telemedicine app development guide covers the build specifics, and telemedicine app features sets out what belongs in a first release.

Clinical and provider tools. Anything a clinician uses during or around care: charting, decision support, referral management, imaging review. Clinical users are unforgiving of friction, so the design constraints run tighter than in consumer software. AI-powered medical diagnosis apps sit here and bring extra regulatory questions.

Operations and admin platforms. Scheduling, claims, credentialing, inventory, remote staff coordination. These rarely reach a patient’s phone, which leads people to assume they sit outside HIPAA. Many of them do not, because the data they move is still PHI.

Remote monitoring. Apps that pull readings from wearables or connected devices and route them to a care team. Device integration and data reliability dominate the build.

Wellness and prevention. Fitness, nutrition, sleep, mental wellbeing. Lightest regulatory load, and the group most likely to drift into PHI territory as features are added.

How to Build a Medical App: The 8 Steps

Step 1. Define the workflow you are replacing

Name the task, and name the person who performs it today. “Improve patient engagement” is a goal. “Stop the front desk phoning forty patients a week to confirm appointments” is a workflow, and it can be built.

Step 2. Map your data and who owns it

List every system your data currently lives in, and who controls each one. A practice management system, a lab portal, a spreadsheet on someone’s desktop, a scheduling tool. For each one, find out whether it has an API, who administers it, and whether that vendor will sign a Business Associate Agreement.

Step 3. List every user role

Write down every distinct type of person who will open the app, and what each one may see. This is the step most often skipped, and it costs more than any other omission. There is a section on why below.

Step 4. Choose your build approach and your MVP scope

Native, cross-platform or web, and which features make the first release. The useful test for scope: does this feature serve the one workflow from step 1? If not, it waits.

Step 5. Design for clinical conditions, not demo conditions

Healthcare users are often interrupted, often rushed, and sometimes older or less confident with technology. Design for one-handed use, poor connectivity and accessibility from the start. Retrofitting accessibility after launch is a redesign.

Step 6. Build the MVP with compliance designed in

Encryption of data at rest and in transit, role-based access control, audit logging of who saw and changed what, and multi-factor authentication. These are architectural decisions, not a pre-launch checklist.

Step 7. Test the app and the access rules

Functional and usability testing, plus a pass that tests permissions specifically. Can a user in one role reach data belonging to another? Check your app store requirements before you submit, rather than after rejection.

Step 8. Launch to a small group, then widen

Ship to one clinic, one department or one cohort, and watch what people actually do. Healthcare workflows rarely behave the way they look in a process diagram, and a narrow launch makes that cheap to discover.

These are not equally reversible. Treating them as a flat checklist is the most common reason a scope changes late and expensively. The next section sorts them by what it costs to change your mind.

None of these eight steps is unusual on its own. The order you take them in is what separates a build that lands from one that stalls, and it is the part most healthcare app development services conversations should start with.

What You Need to Decide Before You Write a Spec

Four of the eight steps set constraints that the rest of the build has to live inside. Get them wrong and you are not adjusting a plan, you are starting again.

The first is the workflow itself. Change what the app is for in month three and every screen, every permission rule and every integration built so far was scoped against the wrong thing.

The second is where your data lives and who owns it. This one catches people because the answer feels administrative. It is architectural. If your appointment data sits in a practice management system whose vendor will not open an API or sign a Business Associate Agreement, your app cannot read it, and no amount of engineering fixes that.

The third is whether you connect to an electronic health record system. EHR integration through FHIR (a modern standard for moving health data between systems, pronounced “fire”) or HL7 v2 shapes your entire data model. Designing for it on day one is normal work. Adding it in month five usually means rebuilding the data layer, and the wider healthcare software development trends point the same way.

The fourth is PHI custody: who signs the Business Associate Agreement, and who is accountable for patient data after launch. This has to be settled before a single real patient record enters the system.

Decision When it locks Cost to change later
Which workflow the app replaces At spec Rebuild
Where the data lives and who owns it At architecture Rebuild
Number of distinct user roles At architecture High
EHR integration, yes or no At data model High
PHI custody and who signs the BAA Before first real user Rebuild
Platform: iOS, Android or both At build start Medium
Feature set inside a defined role Never fully locks Low
Visual design Never fully locks Low

It is worth saying that integration-first thinking has its critics, and they are worth hearing. Adam Carewe, MD, of General Medicine argues that a tool no longer has to be hardwired into the EHR to deliver value, and warns that healthcare leaders still default to treating deep integration as the top priority. My own view is narrower: the decision itself is what locks, so make it deliberately and early, whichever way you go.

Not sure which decisions you have already locked?

Run your feature list through the cost calculator for a ballpark before you

Estimate your build

How Many User Roles Your Medical App Needs (and Why It Drives Cost)

Ask someone what their medical app will do and you get a feature list. Ask how many kinds of people will use it and the estimate usually doubles.

Every distinct role is a separate interface, a separate permission set, and a separate pass of testing. Four roles is not one app with four logins. It is closer to four applications sharing a database, each with its own screens, its own rules about what may be seen, and its own way of being wrong.

The healthcare build that made this clearest to me was a remote operations platform for Collaborative Patient Care Group, a Washington DC firm that provides administrative and operational support to healthcare providers across the US. They were running kiosk-based patient services in medical supply stores, staffed by remote agents, and holding it together with a patchwork of general-purpose remote access tools.

What they needed looked like one product. What it actually required was four: a desktop application running on the kiosk, a second desktop application for the remote agent, a web portal for the client organisation’s own administrators, and a super-admin portal for CPCG itself.

Each had different rules about what its user could see and do. The agent could operate a kiosk, but only inside scheduled hours. The store manager could see their own kiosks and request more, and nothing beyond that. The super admin could silently join a live session for quality review, which is a permission you design deliberately rather than inherit. The same logic governs healthcare CRM software and any system where clinical and commercial roles share a record.

A buyer scoping that project by counting features would have listed video calling, scheduling and reporting, and produced a number that was wrong by a wide margin. The role count was the real driver.

User role What they can see What they can do What it adds to the build
End user / kiosk Their own session only Start and receive support A dedicated interface and device-level controls
Frontline agent Assigned work, in schedule hours Operate the session, request help A second interface plus time-bound access rules
Client administrator Their organisation’s activity Manage assignments, raise requests A web portal and an organisation-scoped data boundary
Super administrator Everything, across clients Audit, configure, override A third portal, audit tooling and the strictest permission logic

Before you brief anyone, write your role list down. If it runs past three, say so in the first conversation, because it changes the shape of the estimate more than any feature you could name. For builds that reach across several systems and role types, this is where healthcare software development work starts rather than ends.

What HIPAA-Ready Means, and What It Does Not Cover

Vendors describe their platforms as HIPAA-ready or HIPAA-compliant, and the claim is usually honest as far as it goes. The gap is what it covers.

A compliant platform handles its own layer: encrypted storage, secure infrastructure, and the willingness to sign a Business Associate Agreement. That agreement is a contract setting out who is responsible for what when a vendor handles patient data on your behalf. It is legally required before you share PHI with any vendor.

What the platform does not do is make your application compliant. Your access rules, your workflows, your staff training, your written policies, your risk assessment and your agreements with every other vendor in the chain remain yours. The scheduling tool, the payment processor, the analytics package and any AI feature that touches patient data each need their own Business Associate Agreement.

There is also no such thing as HIPAA certification. The Department of Health and Human Services does not certify any product or organisation as HIPAA compliant, which means a vendor advertising certification is describing a marketing position rather than a legal one. Compliance is a state you operate in, and it is assessed against how your system actually behaves.

The practical version for a buyer: treat a vendor’s compliance claim as covering their infrastructure and nothing else. Ask which specific services are in scope, get the Business Associate Agreement in writing before any real data moves, and name the person inside your organisation who owns compliance after launch. Our guide to HIPAA compliant app development sets out the full requirement set, and our breakdown of cloud infrastructure for healthcare covers where the platform boundary sits.

How Long It Takes to Build a Medical App

Timelines in healthcare are driven by integration and compliance work far more than by screen count.

Build type Typical timeline What sets the pace
Single-role internal tool 2–4 months One workflow, one user type, no EHR connection
Patient or provider MVP 4–7 months Two to three roles, compliance designed in from sprint one
Multi-role platform 6–10 months Separate interfaces per role, permission logic, audit tooling
EHR-integrated product 9–14 months Integration scoping, vendor timelines and testing sit outside your control

The variable that surprises people most is the one they cannot schedule. Integration work depends on another organisation’s cooperation, and their timeline is not yours.

Cost tracks the same drivers as timeline, with role count and integration doing most of the work. Our healthcare app development cost breakdown sets out the bands and what sits inside each one, and the telemedicine app development cost guide covers that category specifically.

Getting a Medical App Through App Store and Google Play Review

Both stores apply extra scrutiny to health apps, and this catches teams who budgeted for engineering and not for review.

Requirement Applies to What reviewers check
Health data handling disclosure Both stores That you declare what health data you collect and why, accurately
Privacy policy accessible in-app Both stores A working link inside the app, not only on your website
In-app account deletion Both stores That a user can delete their account and data without contacting support
Medical claims in store copy Both stores That your description does not claim diagnostic or treatment capability you cannot evidence
Data safety declaration Google Play That the declared data practices match what the app actually does
Regulated feature evidence Both stores Documentation for anything that behaves like a medical device

Two of these cause most of the delay. Store copy that promises more than the app can evidence gets rejected, and a data declaration that does not match observed behaviour gets rejected. Both are avoidable, and both need checking before submission.

Read the current App Store Review Guidelines and the Google Play health apps policy at the point you write your store listing, not at the point you submit. The rules change, and they change without much notice.

The Four-Gate Medical App Build Readiness Check

Before you write a spec or take a sales call, four things need to be true. Each one is a yes or a no, and a no is a stop rather than a caution.

Gate 1 — Workflow. Can you name the single workflow this app replaces, and the person who performs it today?

Failure mode: the app gets built to a goal rather than a task, and nobody adopts it.

Gate 2 — Data. Do you know every system your data currently lives in, and who owns each one?

Failure mode: an integration turns out to be impossible after the architecture is set.

Gate 3 — Roles. Can you list every distinct user role and what each is allowed to see?

Failure mode: scope and cost move sharply after kickoff.

Gate 4 — Custody. Do you know who signs the Business Associate Agreement and who owns patient data after launch?

Failure mode: compliance gets retrofitted, which is the most expensive way to do it.

Four yeses means you are ready to scope, and the conversation with a partner will be short and accurate. One no means you have one thing to fix, and it is cheaper to fix now than in month four. Two or more means the useful work this month is closing those gates rather than commissioning a build.

Honest limits: Building is the wrong call more often than the industry admits. If the workflow you want to digitise is still changing month to month, you will build the wrong thing. If a product already does ninety percent of it and you are objecting to the remaining ten, buy the product. And if nobody internally will own the app after launch, it will decay, because a medical app is never finished, operating systems update, regulations move, and clinical workflows change whether you planned for it or not.

Conclusion

Most of the eight stages in this guide can be adjusted while you build. Four of them cannot.

If you know the workflow you are replacing, where your data lives, who your users are and who answers for patient data after launch, the rest is execution, and execution can be planned, priced and scheduled.

If any of those four are still open, the useful next step is closing them. That is a cheaper problem to solve this month than it will be in month four.

Get your medical app scoped by a team that has built one

A senior engineer walks your workflow, your roles and your data map, then returns a scoped estimate with the compliance work priced in.

Explore our healthcare app development services

Why Your Mobile App is Being Abandoned and How to Resolve That?

Mobile apps abandonment is a prevalent issue for many app development companies. With a total of 25% mobile apps that are used only ones after their download, it’s a bit scary for mobile app developers, and its high time to improve the app quality to an extent where users find it just perfect and have no reason to leave an app they download. There are some significant issues that prompt users to withdraw or uninstall an app without wanting to know much about it. This blog pinpoints some major issues why an app is being abandoned and how to resolve that.

Mobile apps abandonment rate 2012-2019
Mobile apps abandonment Source Statista

1. Your Onboarding Experience is not Captivating

The first few moments of a mobile app experience is crucial to make an impression on the users. These moments usually define whether the user will stick around the app or not. So, it is vital to take care of the first impression of the app to get a stronghold on user retention. Thus, the first few moments users spend with the app requires to be executed seamlessly.

User on-boarding to the app through the short tutorial, guide how to use the app, or hinting at the bottom establishes users’ first impressions. That is usually the first thing you should keep a check on, especially if you are dealing with quick abandons. So, pay a little extra attention to the on boarding and increase retention.

Moreover, user on-boarding is a serious element, but it should not be complicated for the user. Just a couple of screens with a few precise indicators to the app’s main features is enough to get the users on board.

Make your On-boarding Efficient

Not all the apps give their users an excellent onboarding process when they start with the app. make your app’s onboarding experience simple and intuitive for the user because the more difficult it is for a user to start using an app, there are higher chances of abandonment. To make the onboarding process simple, follow these instructions.

  1. Reduce the number of steps necessary to sign up for an app and include multiple registration options, including Gmail and Facebook login, for instance.
  2. In the beginning, offer app education throughout the onboarding experience to introduce the functionality of the app, but give them “skip” and “learn more” options to not overload them right there.
  3. Teach your users through “pictures performing the action” to educate about the primary gestures in the app.

2. Your Ads Are Annoying

A significant proportion of mobile app users know that they get free apps because ads help them nurture and earn. A lot of users prefer free apps over paid ones, so they are ready to accept ads and consider them an unavoidable thing with the free apps. However, it is a fact that ads annoy users, especially if the ads are not created, placed, and run carefully, they become a cause of annoyance for users. Annoyance is a strong contributor to why a user deletes or stop using an app. You need to be careful about the content of the ad, its placement, and frequency. So, if you understand how to place ad run the ad, you can use advertisement for your app. these are some of the common reasons why ads encourage users to delete the apps.

  1. Your app may contain inappropriate or offensive ads.
  2. The frequency of pop-up and intervening ads is too much.
  3. There are too many ad positions in an app.
  4. They are disruptive, and there is no “exit” button to quit the ad.
  5. They are irrelevant to the user base.

Place Ads Efficiently

Place ads in your app that it looks natural among the surrounding content. Instagram is a perfect app example with an excellent ad system. The ads placement in this app is made to look just like any other post in the app. Neither they are disruptive, nor their frequency is too high. And, the ease of use is excellent for the users as all they need is to swipe up to stop seeing any ad. With proper observation and experience, Instagram has created a perfect ad system to make sure that no offensive ads become the part. In this app, the ads are blended seamlessly with other content without overwhelming them and just about the right amount.

3. Your App Experience is Not Intuitive

One of the most common reasons why users abandon your app is that it is not easy to learn and use. The learning curve of your app needs to easy. The intuitiveness of an app can be defined by gauging the time a user takes to get familiar with the app and its features.

Since mobile app users cannot invest a lot of time in learning how to use an app, one of the major causes, why an app gets abandoned, is its counter-intuitiveness. Moreover, mobile app users do not necessarily have the patience for even a small proportion of confusion in the UX. In simpler words, users want to learn about the features of an app right after using it for a few minutes.

Make Your App Intuitive

To decrease the chances of user abandonment with an app, everything about user interface needs to feel natural, quick to learn. The simply designed gestures are better for the overall usability of an app. This is why most leading operating systems and mobile app development firms have a consistent design pattern in their products. Offering users something that is easy to learn and relate is all about being intuitive, logical, and easy to use.

Increase App Engagement & User Retention

1.   Demonstrate The Benefit in App Store Listing

After creating a full-fledged mobile app for your business, all you need to do is write a copy that sells. An app’s app store listing contributes significantly to attracting users before they make a decision to download an app. You need to clearly mention how your app is addressing the pain point or solve a problem, as users generally look for the benefit of the app provides before downloading. So, you need to include convincing content that correctly demonstrates the value of your app. Businesses that write the copy effectively, and comes true on that by delivering value, see more engagement from users that remain involved over time.

why mobile apps abandon and how to resolve that?
write an app description that perfectly demonstrate your app value.

2.   Offers and Incentives

What else you can do to increase engagement and retention is offers and incentive programs. If your app’s business model allows you to offer rewards or loyalty programs, it can be beneficial to get the most out of this opportunity. These programs not only benefit users to use the product but also make users feel significant and important to a brand.

Provide offer and incentives to decrease mobile app abandonment rate.

3.   Ensure a High-Quality App with Proper Functionality

Proper functionality and quality of an app are two of the most essential steps in boosting engagement and retention rates. Many apps do have minor bugs and loops at the time of launch, but it is important to perform user testing for a product before opening it for users to ensure there are not any significant issues. A thorough quality assurance process help deliver a better product in the market. Be aware of an app lacks proper functionality, users will abandon the app right there, without any hesitation as they have multitudes of options available.

Ensure a High-quality App with Proper Functionality

Every time an app crashes or increases load times, all other app metrics are affected, consequently. Therefore, it is essential to monitor both front-end and back-end functionality to confidently launch the app with a perfect performance.

Final Thoughts

So, you found out the primary causes of mobile app abandonment and how to get this issue resolved. If you think your mobile app suffers through the same problem, this is the high time to instill improvements in your app and present it to the users with better features and guides. Make sure you deliver it with perfect on-boarding and user experience. Feel free to Connect with Appverticals anytime to get all your mobile apps related issues resolved.

How Much Does It Cost to Build a Social Media App in 2026

Social media app development cost runs from $25,000 for a focused community MVP to $400,000 and beyond for a full consumer platform. I have priced enough of these to know that the build number is the part founders fixate on and the part that causes the least trouble. What catches people is the monthly bill that arrives once the app works.

This guide gives you the build bands I actually quote, what each feature costs inside them, and the running costs that decide whether a social product survives its own success.

Most app budgets are a one-time number with a maintenance tail. A social app budget is a one-time number attached to a meter that speeds up every time you succeed.

Key Takeaways

  • Social media app development cost runs $25,000–$60,000 for a scoped MVP, $60,000–$150,000 for a two-platform product with video and real-time chat, and $150,000–$400,000+ for a platform carrying recommendation and trust-and-safety systems.
  • Running costs scale faster here than in any other app category. At 100,000 monthly active users, infrastructure and moderation together run roughly $7,000–$25,000 a month, so a $60,000 build can spend its own cost again inside a year.
  • Video is the single largest multiplier. An image-first product sits at the bottom of every band in this article and a video-first product sits at the top of all of them.
  • Feed ranking is a licence-or-build decision made at architecture stage. Licensing a recommendation engine gives you a predictable monthly cost. Building ranking in-house is a $25,000–$80,000 upfront spend with a permanent maintenance line attached.
  • Content moderation is a mandatory line item, required by Apple’s review guidelines before your first release, with a 24-hour response obligation that applies from day one.

How Much Does It Cost to Build a Social Media App?

The honest starting answer is a range, because the same three words cover a single-purpose community app and a video platform with a recommendation engine. I price social builds in three tiers.

Tier Social media app development cost What you get Realistic timeline
Scoped MVP $25,000–$60,000 Profiles, follow graph, a single chronological feed, image posts, basic reporting. One platform 3–4 months
Mid-complexity $60,000–$150,000 Both platforms, video, real-time chat, push notifications, ranked feed, moderation tooling 5–8 months
Platform-scale $150,000–$400,000+ Live video, recommendation engine, creator tools, ads or payments, trust and safety systems 9–18 months

These bands sit inside the same structure as how app budgets are built across every category we work in. What separates social products is how fast they climb the tiers once real people arrive, and what that climb costs.

One honest note on the MVP band. A scoped MVP at $25,000 to $60,000 gives you a working product with a chronological feed, image posts and a follow graph. Ranked feeds, video pipelines and moderation systems are what move a build into the second tier, and all three are the expensive parts.

Before you read the rest, there is a constraint worth setting up front. Apple’s App Review Guideline 1.2 treats user-generated content as its own category with mandatory requirements, which is why a social app cannot be scoped like an ordinary consumer app. I come back to what that costs further down.

Put a number on your own scope

Answer a few questions about features, platforms and scale, and estimate your social app build cost before you brief anyone.

Estimate your app cost

What Drives Social Media App Development Cost: The Four Features That Set Your Budget

When I break down a social build, four features account for most of the variance between a $30,000 quote and a $150,000 one. The rest of the feature list is rounding.

Social Media App Feed Development Cost: Chronological vs Ranked

A chronological feed is straightforward. Fetch posts from accounts a user follows, order by time, paginate. Budget $4,000 to $8,000.

A ranked feed is a different product entirely. Something has to decide what each user sees first, and that decision engine gets either licensed or built.

Approach Upfront cost Ongoing cost Best for
Chronological feed $4,000–$8,000 Negligible First release, small follow graphs
Licensed recommendation engine $6,000–$15,000 to integrate Monthly fee scaling with usage Most products below platform scale
Custom ranking system $25,000–$80,000 Permanent tuning and data engineering Platforms where the feed is the product

I recommend licensing more often than founders expect. On ParentPass, a family resources and community platform we built for The Miles Foundation, the personalized content feed runs on Recombee, a third-party recommendation engine, with BigQuery underneath as the data layer. That turned feed ranking into a predictable monthly cost and removed a large upfront build from the project.

Building ranking in-house makes sense when the feed is the product itself. Be clear-eyed that the work continues after launch, because a ranking system needs constant tuning against real engagement data.

Video and Image Hosting Costs in a Social Media App

Image posting is cheap. Upload, resize, store, serve. Budget $3,000 to $6,000.

Video is where budgets break. Transcoding into multiple resolutions, adaptive streaming, thumbnail generation and delivery through a CDN, which is a content delivery network that serves files from servers close to each user, runs $15,000 to $40,000 of build work. Live video adds another $30,000 to $70,000 on top.

My standing advice is to launch image-first even when video is the long-term plan. Video costs the same to add later as it does now, and launching without it tells you whether anyone wants the product before you pay for the expensive part.

If you are weighing one codebase against two, native versus cross-platform development changes the engineering number here more than any other decision.

Real-Time Chat and Messaging Feature Cost

Chat looks simple from the outside. Delivery guarantees, read receipts, presence, offline sync, push notification fallbacks and message history all have to work together, and users notice the moment one of them fails.

A third-party messaging SDK costs $8,000 to $15,000 to integrate and carries a monthly fee. Building it yourself runs $20,000 to $45,000. For almost every product below platform scale, I recommend integrating.

Content Moderation Cost and App Store Compliance Requirements

This is the line founders leave out of the brief, and the only one on this list that Apple will stop you shipping without.

Guideline 1.2 requires any app carrying user-generated content to ship four things: a method for filtering objectionable material, a mechanism to report content, the ability to block abusive users, and published contact information. Rejection notices add a fifth requirement that is operational rather than technical, which is acting on reports within 24 hours by removing the content and ejecting the user who posted it.

Read that fifth one carefully, because it is a staffing commitment written as a policy. The 24-hour obligation applies from your first day on the store, whether you have 50 users or 50,000.

The minimum viable build is user reporting, a block function, an end-user licence agreement with an explicit no-tolerance clause, and an admin queue where somebody reviews flagged content. Budget $6,000 to $12,000. Automated screening for images and text, which becomes necessary faster than most teams plan for, adds $10,000 to $25,000 plus per-item API costs.

Moderation is also a field that moves fast enough to follow rather than solve once. Ben Whitelaw, founder and editor of Everything in Moderation and a former community manager, has published a weekly newsletter on content moderation and online safety since 2018, now read by trust and safety teams at most of the large platforms. Regulatory shifts such as the EU’s Digital Services Act surface there well before they reach general tech coverage, and they change what a compliant product has to include.

Age verification, appeals workflows and regional compliance handling belong to platform scale and get priced accordingly. At MVP stage, the thing to understand is that skipping moderation buys you a rejected submission.

What moderation actually costs at MVP stage

$6,000–$12,000 for reporting, blocking, an EULA and a review queue. $10,000–$25,000 more for automated screening. A 24-hour response obligation from launch day, regardless of user count.

Social Media App Maintenance Cost: What You Pay Every Month after Launch

The build number gets all the attention in scoping calls. For a social product it describes roughly half the commitment, because this is the one category where running costs rise faster than the user base.

Why Social App Running Costs Outgrow the Build Budget

The reason is structural. A booking app serves a user who opens it occasionally and pulls a small amount of data. A social app serves users who open it several times a day, each session pulling media from dozens of other accounts, all of which has to be stored, transcoded and delivered.

Traffic grows with users multiplied by sessions multiplied by media weight. That third term is the one nobody forecasts.

Monthly active users Infrastructure and media delivery Moderation Approximate monthly total
1,000 $200–$600 Founder-handled $200–$600
10,000 $800–$2,500 $500–$1,500 in tooling $1,300–$4,000
100,000 $4,000–$15,000 $3,000–$10,000 in tooling and reviewers $7,000–$25,000
1,000,000 $25,000–$90,000 $15,000–$50,000 $40,000–$140,000

Figures exclude salaries. The spread inside each row is almost entirely about media, so an image-first product sits near the bottom and a video-first product near the top.

Read the 100,000 row against the build table above. A product built for $60,000 that reaches 100,000 monthly actives can spend $84,000 to $300,000 in a year keeping the lights on. The build was the cheaper half.

The number I want founders to sit with

A $60,000 social app at 100,000 monthly active users can cost more to run in year one than it cost to build. Model the running cost before you approve the feature list.

Three Budget Decisions the Monthly Numbers Should Change

Monetisation belongs in version one. In most app categories revenue can follow product-market fit at a comfortable distance. Here costs grow with engagement, so a successful launch with no revenue path creates pressure faster than a slow one does. Our guide to app monetization strategies covers the models that hold up when usage itself is the cost driver.

Image-first is a financial decision as much as a scope one. It holds every row of that table near its lower bound while you find out whether the product works at all.

Moderation staffing arrives sooner than planned. Tooling handles volume. Judgement calls need a person, and somewhere around the 100,000 row someone has to review appeals and edge cases. That is a hire, and it belongs in the model.

For a sense of what a community platform looks like at real scale, ParentPass has drawn more than 17,000 users, of whom 12,439 registered and 4,580 browse as guests, across a catalogue of over 7,000 local events. It runs on React Native with a .NET backend across Azure and Google Cloud, and it was built WCAG accessibility compliant from the start instead of retrofitted afterwards.

That last detail saves money in exactly the way the moderation section describes. Accessibility designed in costs a fraction of accessibility added under pressure.

How I Scope a Social Media App Budget

Every estimate I produce for a social product follows the same four steps, and founders can run the first two themselves before talking to anyone.

Step one. Count the roles and the content types. A single-role app with image posts prices very differently from a two-sided network carrying video. These two numbers set the tier before any feature list exists.

Step two. Decide the feed question. Chronological, licensed ranking, or custom ranking. This one choice moves the build by up to $76,000 and changes the monthly bill permanently.

Step three. Model the running cost at your target user count, not at launch. If the numbers only work at 1,000 users, the product has a ceiling rather than a plan.

Step four. Price moderation as scope. Reporting, blocking, an EULA, a review queue, and whoever staffs the 24-hour obligation.

Founders working through this for the first time usually find the mobile app startup guide useful alongside it, since it covers the funding and validation sequence this budgeting sits inside.

If you would rather work through your own projections than a generic table, our social media app development services team scopes builds with the running-cost model attached to the build quote.

Cost to Build an App Like Instagram, TikTok or Facebook

The most common version of this question that reaches me asks what it costs to build something like Instagram or TikTok. The comparison breaks down, and the reason is worth understanding before you set a budget.

What you can see of those products is a few months of work. What sits underneath is a decade of ranking infrastructure, a global CDN footprint, thousands of moderation staff and recommendation systems trained on years of behavioral data. Their current form costs hundreds of millions a year to operate. Their first versions, which are the fair comparison, were far simpler than anything that launches today.

There is a deeper reason clones struggle, and budget does not fix it. In Status as a Service, Eugene Wei, previously a product and strategy leader at Amazon, Hulu and Oculus, argues that social networks succeed by creating a new status game with its own distinctive proof of work. Copying an incumbent’s proof of work recreates a status game that already exists, on a network with nobody in it, which is why he points to near-clones such as App.net as the predictable outcome.

A product that runs the same game with fewer players has a demand problem rather than an engineering one.

What a Niche Social Network Costs Instead

Scope Build cost What makes it viable
Niche community $25,000–$70,000 A specific audience with a shared need that general networks serve badly
Vertical network with a business model $70,000–$180,000 Payments, bookings or marketplace mechanics attached to the social layer
Consumer platform play $180,000–$400,000+ Funding, a distribution advantage, and a monetization path before launch

The first row is where most successful independent social products start, and Wei’s framing explains why. A niche audience is a new status game rather than a borrowed one.

One example from our current work is a mobile-first network built for creative professionals, photographers, musicians and designers, to showcase work, find collaborators and discover opportunities by location and discipline. It exists because general networks moved toward algorithmic entertainment and left that audience without a professional home.

We see the same logic in Hip2Save, where the social layer is a curated feed with community comments and saved lists rather than an open network. The audience arrives for the curation and stays for the community around it.

On budget realism, what an MVP budget really buys applies here with unusual force, because social products carry a floor. A network with nobody in it demonstrates nothing, so the first release has to include enough to make an initial cohort stay.

Hidden Costs That Inflate a Social Media App Development Budget

Trigger What it adds Prevention
Video added mid-build $15,000–$40,000 plus schedule slip Decide before architecture, since retrofitting a media pipeline means revisiting storage, delivery and the app layer
Moderation scoped after launch $10,000–$25,000 under time pressure Ship reporting, blocking and an admin queue in version one
No infrastructure ceiling Unbudgeted monthly spend Set billing alerts and a cost ceiling before launch rather than after the first traffic spike
Feed rebuilt from chronological to ranked $25,000–$80,000 Settle the licence-or-build question during architecture, even if ranking ships later
Accessibility retrofitted Often more than the original UI work Design to WCAG standards from the first wireframe

Four of those five are decisions made at architecture stage that only surface as cost months later. That timing gap is the general shape of overrun on social products, and it is why I push so hard on the scoping steps above.

Conclusion

Social media app development cost runs $25,000 to $400,000+ to build, and $200 to $140,000 a month to operate depending on how many people use it and how much video they watch. The second number decides whether the product survives, and it is the one that rarely appears in a proposal.

Work out what your app costs at 100,000 users before you decide what it costs to build. Every founder I have taken through that sequence has come back with a shorter feature list and a better question.

The products that work tend to start narrow, launch image-first, license what they can, and treat moderation as version-one scope. None of that is a constraint on ambition. It is what keeps the runway long enough to find out whether the audience is real.

Scope your social platform with our social media app development team

Build estimate, infrastructure model, feed architecture and moderation plan, delivered as one costed scope rather than a headline number.


Get Free Consultation

Taxi App Development Cost in 2026: What a Ride-Hailing Build Actually Costs

Taxi app development cost in 2026 runs from about $120,000 for a single-city MVP to $400,000 and beyond for a multi-market platform. Most funded ride-hailing builds land between $180,000 and $280,000. That range is wide because a taxi app is not one application. It is a rider app, a driver app, an operations console and a dispatch engine that matches the first two in real time, and each of those four carries its own price. On top of the build sit costs that bill per completed ride: Google Maps Platform or Mapbox requests, Twilio SMS for one-time passcodes, Stripe processing on every fare, and the real-time infrastructure holding driver locations. This guide prices each surface, grades the dispatch engine by sophistication, and puts numbers on the operating costs that decide whether the unit economics work.

I scope a lot of these. The conversation almost always opens the same way: someone has two quotes, one at $60,000 and one at $240,000, and wants to know which is real. Usually both are, and they are pricing entirely different products.

Key Takeaways

  • A single-market taxi app costs $120,000 to $180,000. A multi-market production platform runs $180,000 to $280,000, and a full-scale operation passes $400,000.
  • You are buying three products, not one: a rider app, a driver app and an operations console. Pricing them separately is the only way to tell whether a quote is honest.
  • The dispatch engine is the largest unpriced variable. Nearest-driver matching costs around $15,000. Demand-predictive positioning costs ten times that.
  • Every completed ride costs roughly $0.35 to $1.30 in platform running costs before payment processing, driven mostly by mapping API calls.
  • Licensing, commercial insurance and driver background checks routinely cost more per year than the software did to build.
  • Ride-hailing products fail on driver supply far more often than on app quality. Budget driver acquisition alongside the build.

How Much Does Taxi App Development Cost?

Three tiers cover almost every ride-hailing build I have scoped. Find yours before you read anything else.

Build tier What it covers Cost Timeline
Single-market MVP Rider and driver apps on one cross-platform codebase, nearest-driver dispatch, one payment provider, a basic admin panel, one city $120,000 – $180,000 5 – 7 months
Multi-market production Adds ETA-based matching, surge pricing, scheduled rides, automated driver payouts, ratings and disputes, a real support console $180,000 – $280,000 8 – 12 months
Full-scale platform Adds batched matching, multi-city operations tooling, fraud detection, corporate accounts, and native apps where performance demands it $280,000 – $450,000+ 12 – 18 months

If you are pricing your first release rather than a full platform, a scoped MVP is the sensible shape: one city, one payment provider, the simplest dispatch that works. For how these bands compare against app builds generally, what an app build costs across all categories covers the wider picture.

Why an App Like Uber Is Really Three Apps

When somebody tells me they want an app like Uber, they are describing three applications and a dispatch engine. Saying that out loud early makes the rest of the pricing conversation straightforward.

The rider app is what people picture. Book a ride, watch a car approach, pay, rate. It is the smallest of the three.

The driver app is a different product with different constraints. It runs for eight hours straight in a moving vehicle, reports location continuously without destroying the battery, handles job offers under a countdown, and shows earnings people will argue about. Battery and network behaviour matter more here than anything visual.

The operations console is a web application and it is the one first-time founders forget entirely. Someone has to approve drivers, resolve a dispute over a fare, refund a rider, adjust pricing for a zone, and see what is happening across the city right now. Without it you are running a marketplace from a spreadsheet.

The dispatch engine sits underneath all three, deciding which driver gets which ride. It has no interface at all, which is exactly why it gets left out of quotes.

A quote that gives you one number for “a taxi app” has made a decision about all four of these on your behalf, and has not told you which one. Ask for the four line items separately. The answer tells you more about the vendor than the total does.

Taxi App Development Cost by Surface

Here is how a mid-tier build in the $180,000 to $280,000 band typically distributes.

Surface What it is Share of build Cost at mid-tier
Rider app Booking, live tracking, fare estimate, payment, ratings, ride history 24% $43,000 – $67,000
Driver app Online/offline state, job offers, navigation handoff, earnings, documents 21% $38,000 – $59,000
Dispatch & matching engine Driver allocation, ETA calculation, zone and surge logic 18% $32,000 – $50,000
Operations console Web: driver approval, fleet view, disputes, payouts, city configuration 16% $29,000 – $45,000
Backend & real-time infrastructure APIs, location streaming, database, scaling, observability 13% $23,000 – $36,000
Design across three surfaces Two mobile design systems plus a dense web console 8% $14,000 – $22,000

The console is the line most often cut, and cutting it does not remove the work. It moves it onto whoever is operating the service, who then does the job by hand at a cost that recurs every single day.

Capacity and allocation logic is the same class of problem across on-demand categories. A capacity-managed services platform we built faced the same structural cost: multiple surfaces, and overbooking resolved by people rather than by the system.

The Dispatch Ladder: What Your Matching Engine Costs

This is where ride-hailing budgets go wrong most often. Matching a rider to a driver sounds like one feature. It is a ladder of four increasingly expensive approaches, and the one you need is set by ride volume, not ambition.

Tier How it matches Build cost When it stops being enough
1. Nearest available Straight-line distance to the closest free driver $15,000 – $25,000 Around 200 rides a day, or the first time a river or a one-way system makes the closest driver the slowest one
2. ETA-optimised Real routing time using live traffic, not distance $25,000 – $50,000 Around 2,000 rides a day, or when drivers start complaining about unfair allocation
3. Batched optimisation Holds requests for a few seconds and solves a batch together $50,000 – $120,000 Rarely. This tier serves dense multi-zone operations well past 2,000 rides a day
4. Predictive positioning Forecasts demand and repositions idle supply before requests arrive $80,000 – $200,000+ Mature multi-city operations with historical data worth modelling

Almost every launch belongs on tier one. A single city doing a few hundred rides a day does not need traffic-aware routing, and paying for it delays launch by two months for no measurable gain.

Tier two is where most successful operators end up within eighteen months. The trigger is usually geography rather than volume: the moment a bridge, a river or a one-way system means the nearest driver is not the fastest driver, straight-line matching starts producing allocations that riders and drivers both find unfair.

Tier four is a machine learning problem rather than a routing one, and it carries the cost profile of one. AI features carry their own cost structure, including inference costs that scale with every prediction you make.

WHAT SURPRISES PEOPLE MOST: Build the tier your ride volume justifies, then build the next one when the complaints start. I have never seen a ride-hailing launch fail because its matching was too simple. I have seen several delayed by six months building matching for volume they did not yet have.

Get a number for your own scope

Run your surfaces and expected ride volume through the cost calculator for a starting band.


Open the app cost calculator

Feature Costs Across Rider, Driver and Admin

The same feature name can mean very different work depending on which surface it lives on. Here is what the core set costs when built properly across all three.

Feature Rider Driver Admin Cost band across all surfaces
Registration, verification and profiles Yes Yes Yes $8,000 – $18,000 (driver side carries document upload and approval)
Live location and tracking Yes Yes Yes $12,000 – $28,000 (the driver side is the hard part — continuous reporting without draining a battery)
Booking and ride request flow Yes Yes $10,000 – $22,000
Fare estimation and calculation Yes Yes Yes $8,000 – $20,000
Surge and zone pricing Yes Yes Yes $10,000 – $25,000
In-app payments and driver payouts Yes Yes Yes $15,000 – $35,000 (payouts are usually harder than collections)
Masked calling and in-app chat Yes Yes $6,000 – $15,000
Ratings, reviews and disputes Yes Yes Yes $7,000 – $16,000
Scheduled and repeat rides Yes Yes Yes $8,000 – $18,000
Driver approval and document expiry Yes Yes $9,000 – $20,000
Reporting and operations dashboards Yes $10,000 – $25,000

Scope discipline matters more here than feature count. Deciding which use cases your product actually serves before pricing anything tends to remove a third of the list on its own.

Platform and Tech Stack: What Each Choice Costs

You are making this decision three times, once per surface, and the right answer is not the same for all three.

Rider and driver apps both benefit from a shared cross-platform codebase. React Native or Flutter will carry booking, tracking, payments and notifications comfortably, and running one codebase instead of four separate native builds typically saves 30 to 40% against dual-native across both apps.

The driver app is the one place I would consider going native, and only for a specific reason: continuous background location over an eight-hour shift, where battery behaviour and OS background limits are the whole game. If early testing shows unacceptable battery drain, budget a native driver app and keep the rider app cross-platform.

The operations console is a web application. Build it as one. It never belongs in a mobile framework.

The full trade-off between running one codebase and maintaining two native ones applies here with double force, because you are carrying two mobile products rather than one.

Developer rates by region move the total as much as any technical choice, and that arithmetic is the same for a taxi app as for anything else. It is covered properly on our general cost breakdown rather than repeated here.

Own Fleet or Aggregator: How the Business Model Changes the Build

These two models look similar to a rider and cost different things to build.

If you own the fleet and employ the drivers, you are building a dispatch and fleet management system with a booking front end. Driver onboarding is an internal process, payouts are payroll rather than marketplace settlements, and you control supply directly. The console gets heavier, the payment layer gets lighter, and the whole thing is cheaper.

If you are running an aggregator marketplace, you are building a two-sided platform. Drivers are independent, so you need self-service onboarding with document verification, commission logic, individual payout rails, tax reporting, and a dispute process between two parties you do not employ. Budget 20 to 30% more for the same feature list.

The second model is also where the regulatory load lands hardest, which is the next section.

Demand across on-demand transport keeps rising, and the wider mobile market data gives useful context for sizing the opportunity before committing a budget to it.

What a Completed Ride Costs to Run

This is the table I wish every ride-hailing founder saw before signing a build contract. A taxi platform bills you per ride, whether or not anyone is writing code.

Line item Typical unit price Calls per ride Cost per completed ride
Maps and geolocation APIs $0.005 – $0.02 per request 15 – 40 $0.08 – $0.60
SMS and one-time passcodes $0.008 – $0.05 per message 2 – 6 $0.02 – $0.25
Push notifications Negligible below high volume 6 – 12 Under $0.01
Real-time infrastructure and location streaming Usage-based $0.01 – $0.05
Cloud compute, storage and bandwidth Usage-based $0.02 – $0.08
Payment processing ~2.9% + $0.30 per transaction 1 Scales with fare value
Blended platform cost per ride $0.35 – $1.30 before payment processing

Mapping is the line that surprises people. A single ride can fire geocoding on pickup, route calculation, repeated ETA refreshes while the driver approaches, live navigation, and a final distance calculation for the fare. Forty requests on one ride is unremarkable.

Run the arithmetic against your own numbers before you build. At a thousand rides a day, a blended cost of eighty cents a ride is roughly $24,000 a month in running costs alone, on top of the build, before a single developer is paid to maintain anything.

THE FINDING THAT CHANGES BUDGETS: The number that decides whether your business works is contribution margin per ride, and it is knowable before you write any code. Take your expected average fare, subtract your commission model, subtract payment processing, subtract the blended platform cost above, and subtract driver incentives. If the result is not comfortably positive, no amount of app quality will fix it.

Licensing, Insurance and Driver Onboarding Costs

The software is often not the largest number in a ride-hailing budget. These are.

Requirement What it is Typical US cost Frequency
Operating permit or TNC licence Authority to run a transportation network company, issued per state and sometimes per city $1,000 – $100,000+ Annual, per jurisdiction
Commercial or contingent liability insurance Cover across the three phases: driver online, en route to pickup, passenger on board $3,000 – $12,000 per vehicle Annual
Driver background checks Criminal and driving record screening, often mandated $25 – $75 per driver On onboarding, frequently re-run annually
Vehicle inspections Safety inspection and certification $20 – $150 per vehicle Annual
Accessibility obligations Some cities mandate a proportion of wheelchair-accessible vehicles or an equivalent service level Varies widely Ongoing

Insurance is usually the largest single operating cost and the one least often modelled at the budgeting stage. A hundred-vehicle fleet at the middle of that range is around $750,000 a year, which dwarfs any build in this article.

The practical consequence for your software budget is that compliance features stop being optional. Document expiry tracking, automated re-screening reminders and inspection records all need to exist in the operations console, because a lapsed driver document is a legal exposure rather than an inconvenience.

White Label or Custom Taxi App Development: The Threshold

White-label ride-hailing platforms are real and sometimes the right answer. I will make the case against my own service where it applies.

A white-label product will get a single-city operator live in weeks for a setup fee plus a monthly licence, typically somewhere between $5,000 and $30,000 to start and a recurring per-driver or per-ride charge after that. For a taxi firm digitising an existing fleet, that is frequently the correct decision.

Four gates decide it. Answer yes to two or more and custom development is the right call.

  1. Does your dispatch logic differ from standard nearest-driver or ETA matching in a way that is central to your offer? Scheduled medical transport, school runs and corporate accounts all break the default model.
  2. Do you need to integrate with systems the platform does not support — an existing booking system, a fleet telematics provider, a corporate travel tool, or a municipal transport authority?
  3. Is your expected volume beyond what a per-ride licence makes economic? Run the arithmetic: at high volume, licence fees frequently exceed the amortised cost of building.
  4. Is the app the business, or a channel for a business that already works? If riders choose you because of the product experience, you need to own it.

Zero or one yes: start white label, revisit in twelve months. Telling people that occasionally costs us a project and saves them from a bad one.

Taxi App Development Cost in Practice: What a Real Matching Engine Took to Build

Lulo Freight is a Texas freight logistics platform. It came to us after a previous development partner could not complete the work to the agreed scope, which is the most expensive way to build software — everything gets paid for twice.

The core of what we finished is a matching problem structurally identical to ride-hailing. A load board pairs carriers to freight by fleet capacity, alongside real-time shipment tracking, instant transparent quoting for shippers, and payment and driver management on the carrier side. It runs on Laravel and React Native with MySQL, Firebase and AWS.

Substitute rider for shipper and driver for carrier and the architecture is the same: a two-sided marketplace where supply has capacity constraints, demand arrives unpredictably, and the system has to allocate one to the other while both parties watch it happen live.

The costing lesson transfers too. The matching layer and the payment and driver management subsystem were the expensive parts, and neither has a screen a client sees during a demo. That is precisely why they get underestimated in quotes.

You can see more of the platforms we have delivered across logistics, on-demand services and marketplaces.

The Cost Nobody Budgets: Getting Drivers on the Platform

Here is the part I would rather you heard now than in month four.

Ride-hailing products almost never fail because the app was bad. They fail because there were not enough drivers online when riders opened the app, riders waited eleven minutes, and they stopped opening the app. Supply is the business.

Driver acquisition costs money in a way that does not appear in any build quote. Referral bonuses, guaranteed minimum earnings during launch weeks, onboarding support, and the background checks and inspections from the previous section all recur per driver. Operators frequently spend more acquiring their first few hundred drivers than they spent on the software.

The budgeting consequence is concrete: model driver acquisition alongside the build, in the same document, before you commission anything. A platform with an excellent dispatch engine and forty drivers performs worse than a plain one with four hundred.

The software decision that follows from this is to fund the driver app properly. If it drains batteries, loses jobs on patchy coverage, or makes earnings hard to understand, drivers leave, and that is the expensive failure.

If you have a fixed budget and have to choose, spend it on the driver app and the dispatch engine rather than on the rider app. Riders forgive a plain interface if a car arrives in four minutes. They forgive nothing if it arrives in fourteen.

Conclusion

The headline range for a taxi app is wide because the question hides four separate products. Once you price the rider app, the driver app, the operations console and the dispatch engine as distinct line items, the number stops being a mystery and starts being a set of decisions you can make.

Pick your dispatch tier against the ride volume you actually expect in year one, not the volume you hope for in year three. Model the per-ride running cost before you commission anything, because that arithmetic either works or it does not, and it is knowable now. Then budget driver acquisition in the same document as the build, because that is where these businesses are won and lost.

A vendor who can price those four surfaces separately has scoped the work. One who gives you a single number for a taxi app has made four decisions on your behalf without telling you which.

Pricing a ride-hailing build?

We scope rider, driver, console and dispatch as separate line items with module-level hour counts, so you can challenge the scope instead of arguing about a total.

Explore our travel and mobility app development

Mobile App Maintenance Costs in 2026: What App Owners Actually Pay

Mobile app maintenance costs run 15–20% of the original build cost every year once the app is stable, and 30–50% in year one while the codebase settles. For a $120,000 app, that is roughly $36,000 to $60,000 in the first twelve months and $18,000 to $24,000 a year after that. The money goes to six recurring places: cloud hosting and infrastructure, Apple Developer Program and Google Play Console fees, crash monitoring and analytics tooling, third-party SDK and API subscriptions, security patching and compliance work under HIPAA, PCI DSS or GDPR, and developer hours for OS compatibility releases. What moves the number is rarely app size. It is architecture, how many third-party dependencies you carry, whether you maintain one codebase or two, and who owns your backend.

This guide breaks down what each line item costs, how to forecast your own figure, and what a maintenance agreement should specify before you sign it. I have scoped a lot of these conversations. The pattern is consistent: someone arrives with a quote in hand, a percentage rule they read somewhere, and no way to tell whether the two match. What follows is how I work that out.

Key Takeaways

  • Steady-state mobile app maintenance costs run 15–20% of the original build cost per year. Year one typically runs 30–50% while the codebase settles.
  • Most live apps sit between $500 and $5,000 a month. Regulated or real-time apps in healthcare, fintech and on-demand run $5,000 to $20,000 and above.
  • Six recurring line items carry almost the whole bill: hosting, app store fees, monitoring, third-party services, security and compliance, and developer hours.
  • Architecture drives the number harder than feature count. Two native codebases, a deep third-party dependency tree, and no automated tests are the three largest multipliers.
  • On a $150,000 build, cumulative maintenance passes the original build cost early in year five.
  • Emergency fixes bill at three to five times planned rates, which makes an agreed response-time SLA a cost control rather than paperwork.

How Much Does Mobile App Maintenance Cost?

Plan for 15–20% of your original build cost per year once the app is stable, and 30–50% in the first twelve months. The first year runs high because real users find defects that testing did not, and because the team is still learning the production behaviour of a system it only ever saw in staging.

Here is what those percentages look like in dollars.

Initial Build Cost Year One (30–50%) Steady-State Annual (15–20%) Steady-State Monthly
$50,000 $15,000 – $25,000 $7,500 – $10,000 $625 – $835
$100,000 $30,000 – $50,000 $15,000 – $20,000 $1,250 – $1,670
$150,000 $45,000 – $75,000 $22,500 – $30,000 $1,875 – $2,500
$250,000 $75,000 – $125,000 $37,500 – $50,000 $3,125 – $4,170
$500,000 $150,000 – $250,000 $75,000 – $100,000 $6,250 – $8,335

The percentage is a starting anchor. It works because build cost is a rough proxy for how much system there is to keep alive, and it fails whenever that proxy breaks, two apps built for the same money can differ by a factor of three in what they cost to run, which is why the rest of this article is about the factors underneath the number rather than the number itself.

If you do not have a build figure to apply the percentage to, start with what the build itself costs and work forward from there.

Where the Money Goes: The Six Recurring Line Items

Split your mobile app maintenance budget into two halves before you do anything else. One half runs whether or not a single line of code changes. The other half only bills when someone is actually working on your app.

That split is the most useful thing I can give a founder in a first conversation, because it tells you which costs you can forecast to the dollar and which ones move.

Costs that run on their own

  • Cloud hosting and infrastructure. Small apps with a few hundred users sit around $70–$320 a month. Mid-size apps with steady traffic land at $500–$2,000. Apps handling real-time data or thousands of concurrent users climb past $2,000 and keep going as capacity scales.
  • App store fees. The Apple Developer Program is $99 a year. Google Play Console charges a one-time $25 registration fee. These are the smallest and most predictable numbers on the list.
  • Monitoring and analytics. Crash reporting and performance tooling — Crashlytics, Sentry, Datadog — runs anywhere from free at low volume to $200–$1,500 a month once you are tracking sessions at scale.
  • Third-party services. Every SDK and paid API in your stack bills monthly: payment processing, push notifications, mapping, authentication, SMS, email. Budget $200–$2,000 a month depending on how many you carry.

Costs that bill when someone works

  • Developer hours for OS compatibility. Apple and Google ship major releases every year. Each one can deprecate an API you depend on, and skipping enough of them gets your listing pulled. This is the line item first-time budgets leave out. Our guide to building and maintaining an iPhone app covers what a release cycle actually involves.
  • Security patching and compliance. Routine patching runs $250–$500 per update. A professional security audit runs $1,000–$5,000. A full penetration test on a complex app runs $5,000–$15,000 and up.

Infrastructure and tooling will cost you a few hundred to a few thousand dollars a month no matter what. Developer hours are what actually move your annual number, and they are the only part of the bill you have real control over.

 App Maintenance Cost by Complexity: Simple, Mid-Market and Enterprise

The tier your app sits in tells you more than its feature list does. Here is where the three bands land.

App Tier Typical Examples Monthly Annual Share of Build
Simple Content apps, booking tools, single-purpose utilities, internal apps $500 – $1,500 $6,000 – $18,000 12–18%
Mid-market E-commerce, marketplaces, apps with user accounts, payments and a handful of integrations $1,500 – $5,000 $18,000 – $60,000 15–22%
Complex, regulated or real-time Healthcare, fintech, logistics dispatch, on-demand platforms, anything with live data or audit obligations $5,000 – $20,000+ $60,000 – $240,000+ 20–35%

Most of the companies I work with sit squarely in the middle band and get costed as though they belong in one of the other two. The guidance written for solo developers underestimates what an app with payments and a real user base takes. The guidance written for enterprise buyers assumes a compliance and procurement overhead that a forty-person company does not carry.

Platform choice shifts the tier boundaries too. A cross-platform build maintained as one codebase sits lower than two native apps of the same scope, and the gap widens every year as both platforms ship releases. If you are still deciding, iPhone app development costs break down the same arithmetic on the build side.

What Each Type of Maintenance Actually Costs

The international standard for software maintenance, ISO/IEC 14764, sorts this work into four categories. In practice there is a fifth, and it is the one that wrecks budgets.

Type What Triggers It Typical Cost Planned?
Corrective — fixing defects Bug reports, crashes, broken flows $1,000 – $5,000 per fix cycle; 20–30% of the annual budget Semi-planned
Adaptive — keeping up with the outside world Annual iOS and Android releases, deprecated APIs, SDK version bumps $2,000 – $10,000 per platform per year Planned
Preventive — reducing future work Dependency upgrades, refactors, documentation, test coverage $1,000 – $5,000 per quarter Planned
Perfective — improving what exists User feedback, UX refinement, performance tuning $5,000 – $25,000 per enhancement Planned, scoped separately
Emergency — something is on fire Outage, security incident, store removal, payment failure Three to five times standard rates: $300–$1,000 an hour against a typical $100–$200 Unplanned

Preventive maintenance is the category people cut first and regret most. Every dependency upgrade you defer becomes a larger upgrade later, because the version gap grows and the migration path gets longer. That is technical debt in its most literal form, you are paying interest on work you chose not to do.

Year One vs Steady State, and the Five-Year Total

The single most useful thing you can do with a maintenance budget is model it across the whole product life rather than one year at a time. Here is a $150,000 build carried through five years at mid-range percentages.

Year Annual Maintenance Cumulative Cumulative as % of Build
Year 1 $60,000 (40%) $60,000 40%
Year 2 $27,000 (18%) $87,000 58%
Year 3 $27,000 (18%) $114,000 76%
Year 4 $30,000 (20%) $144,000 96%
Year 5 $33,000 (22%) $177,000 118% — CROSSOVER

Cumulative maintenance passes the original build cost early in year five. That is the number I want in front of every founder before they sign a development contract, because it reframes the build as roughly half of what the product will cost you.

Two things drive the curve back upward in years four and five. Dependencies drift further from current versions the longer the app runs, so each upgrade costs more than the last. And the people who built it have usually moved on, so every change now starts with someone reading unfamiliar code.

THE FINDING THAT CHANGES BUDGETS: Across a normal five-year product life, you will spend more keeping the app alive than you spent building it. Plan the maintenance line before you sign the build contract, not after.

Daniel D. Galorath, founder and CEO of Galorath Incorporated and author of Software Sizing, Estimation, and Risk Management, puts software maintenance at roughly 75% of total cost of ownership across a system’s life. His firm’s position, presented at the ISPA/SCEA international conference, is that decisions made during development, specifically maintainability decisions, are the dominant lever on total ownership cost.

That matches what I see. By the time someone calls me about a maintenance bill, the number was mostly set two years earlier, in architecture choices nobody thought of as budget decisions.

Compliance Costs: What HIPAA, PCI DSS and GDPR Add to Maintenance

Regulated apps carry a maintenance load that has nothing to do with features. Compliance work is recurring by design: evidence has to be regenerated, controls have to be re-tested, and vendor agreements have to be re-signed.

Regulation What It Adds to Ongoing Work Annual Cost
HIPAA Business associate agreements with every vendor touching patient data, audit logging, annual risk assessment, encryption review $20,000 – $60,000
PCI DSS Quarterly vulnerability scans by an approved vendor, annual self-assessment or report on compliance, tokenisation upkeep $15,000 – $40,000
GDPR / CCPA Consent management, data subject access request handling, records of processing, annual review $8,000 – $25,000
SOC 2 Type II Continuous control monitoring, evidence collection, annual audit fee $25,000 – $60,000
COPPA Age gating, parental consent flows, data minimisation review $10,000 – $30,000

Two of these stacking is common and the cost is not additive in the way people expect, a healthcare app taking card payments carries HIPAA and PCI DSS, and the shared evidence work between them saves less than you would hope, because the auditors are different and the control sets barely overlap.

If you are budgeting a regulated build from scratch, healthcare app development costs cover the compliance overhead on the build side.

The Maintenance Load Score: Six Factors That Set Your Mobile App Maintenance Cost

Percentages tell you what a typical app costs. This tells you what yours costs.

Score your app on each of the six factors below, from 0 to 3. Add them up. The total maps to a predicted annual band.

Factor 0 Points 1 Point 2 Points 3 Points
1. Codebases you actively maintain One cross-platform One native Two native Three or more, incl. web or wearable
2. Paid third-party SDKs and APIs 0–2 3–5 6–10 11 or more
3. Who runs your backend Fully managed service Managed plus a few custom services Self-managed cloud servers Own infrastructure or hybrid
4. Automated tests and CI/CD Both, with meaningful coverage Pipeline only, thin tests One or the other Neither; manual releases
5. Regulatory surface None GDPR or CCPA PCI DSS or SOC 2 HIPAA, or two or more regimes
6. Release cadence Quarterly or less Monthly Fortnightly Weekly or faster

Your score, and what to budget:

Total Score Predicted Annual Maintenance
0 – 4 12–15% of build cost
5 – 8 15–18%
9 – 12 18–25%
13 – 15 25–32%
16 – 18 32–40% and above

Factor one is where most of the spread comes from. Two native codebases means every fix, every OS release and every dependency upgrade happens twice, on two release cycles, with two sets of platform-specific defects. If you are early enough to still be choosing, maintaining one codebase instead of two is the largest single cost decision available to you.

The effect is large enough that our own software development cost estimation guide puts a poorly architected $100,000 build at around $40,000 a year to maintain, against roughly $20,000 a year for a well-built $150,000 one. The bigger project is the cheaper one to keep alive.

Factor four is the one clients push back on hardest and the one I defend most. Automated tests feel like a cost during the build and behave like a discount for the rest of the product’s life, because a regression caught by a pipeline costs minutes and the same regression caught by a user costs a hotfix release.

WHAT SURPRISES PEOPLE MOST: The factor that pushes a quote higher than expected is almost never the feature list. It is the dependency count. An app carrying eleven paid SDKs has eleven vendors who can change their terms, deprecate an endpoint or raise a price without asking you.

How to Calculate Your Mobile App Maintenance Cost in Four Steps

The Load Score gives you a percentage. These four steps give you a figure you can defend line by line in a budget meeting.

Step 1 — Inventory every recurring subscription.

Open a spreadsheet with two columns: service and monthly cost. List hosting, database, CDN, storage, payment gateway, push notifications, analytics, crash reporting, authentication, email, SMS, maps. If it bills, it goes on the list. Most teams find two or three services nobody remembers signing up for.

Step 2 — Project infrastructure against twelve months of growth.

Find your hosting provider’s next pricing tier and work out what usage level triggers it. If you are at 5,000 users and expect 20,000, price that tier now rather than discovering it on an invoice.

Step 3 — Estimate labour by task type.

Take the recurring work; minor fixes, performance tuning, third-party API updates, the annual OS compatibility release, security patches, and estimate hours for each at your team’s blended rate. The OS release is usually the biggest single block and the one people forget.

Step 4 — Apply your Load Score band and reconcile.

Multiply your build cost by the predicted percentage from the table above. Compare it against the total from steps one to three. If the two figures are more than 30% apart, one of them is wrong, and it is usually step three, because labour estimates run optimistic.

Work out your own number first

Run your build scope through the app cost calculator to get a baseline, then apply your Load Score band to it.


Open the app cost calculator

In-House vs Agency Retainer vs Freelance: Annual Cost Compared

Three ways to staff maintenance, three very different cost shapes. The comparison below assumes a mid-market app needing roughly 20 to 40 hours of work a month.

Delivery model Annual cost What you get What you do not get Best fit
In-house engineer $170,000 – $215,000 fully loaded (base $130k–$165k plus payroll tax, benefits, equipment, tooling) Deep product knowledge, immediate availability, full control Multi-skill coverage. One mobile engineer is not also a backend, QA and DevOps engineer. You also pay for idle capacity in quiet months Companies where the app is the product and 40+ hours a month of work genuinely exists
Agency retainer $30,000 – $96,000 ($2,500 – $8,000 a month for 20–60 hours) A mix of iOS, Android, backend, QA and DevOps skills. Cover during leave. Contracted response times Instant context on a codebase they did not write, unless you fund a handover Most mid-market apps. Predictable, and scales down without a redundancy conversation
Freelance or ad-hoc $12,000 – $40,000 (US $60–$150/hr; offshore $30–$70/hr) The lowest cost in quiet months Guaranteed availability, cover, or an SLA. Emergency work is charged at a premium and you are behind whoever is on retainer Simple apps that are stable and not business-critical

The honest comparison is between an in-house hire and a retainer, and it turns on one question: does 40 hours a month of genuine maintenance work exist? If it does, a hire is usually better value and you get the product knowledge for free. If it does not, you have hired a full-time engineer who will drift into feature work, which is how maintenance quietly stops happening.

What a Mobile App Maintenance Contract Should Cost You to Include

The number matters less than what sits behind it. Here is what I tell clients to get in writing before they sign anything, whoever they sign it with.

  • Severity levels defined. What counts as critical, high, medium and low, with an example of each.
  • Response time per severity. How long until someone acknowledges the issue.
  • Resolution target per severity. How long until it is fixed, or until you get a workaround and a plan.
  • Coverage hours. Business hours in which time zone, and what happens at 2am on a Saturday.
  • What is included versus billable. Bug fixes in, new features out — and who decides which one a given request is.
  • Hours bank and rollover. How many hours a month, whether unused hours roll forward, and for how long.
  • Rate for work beyond the retainer, and the emergency rate, stated as a number.
  • Change request process. How new work gets scoped, quoted and approved.
  • Code and account ownership. Repository, cloud accounts, app store listings, signing certificates and API keys all in your organisation’s name, with the vendor granted access.
  • Documentation obligations. What gets written down, and where it lives.
  • Exit and handover. Notice period, what gets transferred, how long handover support runs, and at what rate.
  • What you receive each month and in what format.

Ownership is the clause that costs the most when it is missing. If a vendor holds your signing certificate or your App Store account, moving away from them is a project rather than a decision. I have watched that take three months.

The other clause worth reading slowly is the uptime commitment. Most of them exclude outages caused by third-party services, which on a typical mobile app is most of what can go wrong. Read the exclusions before the headline percentage.

If you are at the stage of comparing providers, how to vet a development partner covers the evaluation criteria that apply to maintenance work as much as to a build.

Mobile App Maintenance Cost in Practice: What Fragmented Architecture Actually Costs

Spruce is a US home and property services platform. Residents, property managers and service professionals book cleaning and chore services through it, and the business runs across a resident mobile app plus separate web portals for admins, providers and property managers.

By the time the work came to us, the cost of that shape had become the problem. The architecture had grown in pieces rather than being designed as a system, and the practical effect was that routine changes had stopped being routine. Every update had to be reasoned about across multiple surfaces, and the team could not confidently predict what a change would touch.

Two things were structurally expensive. Service professionals had no mobile app at all, so work that belonged in an app was being handled through channels that needed manual support. And there was no capacity management, which meant overbooking was resolved by people rather than by the system — a support cost that scales with growth.

What we did was a full system redesign rather than a series of patches: role-specific workflows across mobile and web, a capacity management layer, and a structured pricing model that adjusted by region, floor plan and square footage instead of being maintained by hand.

The transferable lesson has nothing to do with home services. Spruce’s maintenance burden was set by architecture, not by feature count — multiple surfaces, fragmented ownership, and manual processes standing in for missing system logic. That is factors one, three and four of the Load Score, showing up as a monthly bill.

You can see more of the platform rebuilds we have delivered if it helps to see the pattern across other industries.

What Your Maintenance Budget Does Not Cover

This is the part I would rather you read from me than discover in month four.

New features are not maintenance. A retainer keeps what exists working. Anything that adds functionality is a change request, scoped and priced separately. Teams that blur the line end up funding features out of the maintenance budget, and then the security patches get deferred until next month, six months running.

Re-platforming is not maintenance. Moving from one framework to another, rebuilding the backend, or migrating to a different cloud provider are projects. The 15–20% figure does not cover them and was never meant to.

A major framework migration is not maintenance either. When a framework ships a breaking major version, the upgrade is scoped work. Budget it separately the year it lands.

An SLA does not cover third-party outages. If your payment provider goes down, your app is down, and almost no maintenance agreement makes the vendor liable for that. What a good agreement gives you is someone who notices quickly and communicates while it is happening.

Design refreshes are not maintenance. Keeping the interface working is maintenance. Making it look current is a project.

MY TAKE: The mistake I spend the most energy heading off is treating the maintenance retainer as the feature budget. It works for about a quarter. Then the roadmap stalls and the patches are three months behind, and you have paid for both problems at once.

Conclusion

The percentage rule is a starting point. Fifteen to twenty percent of build cost tells you roughly what to reserve, and tells you nothing about why your number sits at the top of that band instead of the bottom.

That answer lives in your architecture, how many codebases you maintain, how deep your third-party dependency tree runs, who owns your backend, and whether anything automated catches a regression before a user does.

Score your app against the six factors, put a defensible figure in next year’s budget, and take the contract checklist into your next conversation with whoever maintains your app. The number matters far less than knowing what you are buying with it.

Not sure what your app should cost to maintain?

We will score your current architecture against the six factors above and give you a maintenance figure you can put in a budget, with the scope behind it written out.

Grocery App Development: Models, Costs, Systems and How to Choose a Partner

Grocery app development covers the four connected systems a grocery business needs to sell online: a customer ordering app, a picker app for store staff, a driver app for delivery, and an admin panel that ties them together. In the US a full build typically runs $45,000 to $280,000 over three to twelve months, depending almost entirely on how you fulfil orders.

The budget conversation usually starts with features. It should start with fulfilment. Whether you hold your own stock, aggregate other people’s stores like Instacart, or run a dark store for fifteen-minute delivery decides your architecture, your integration list and most of your cost before a single screen is designed.

This guide covers the four surfaces you have to fund, the inventory and substitution problems that break grocery products after launch, the POS and compliance work nobody scopes early enough, cost bands by model, how these apps actually make money, and how to evaluate the company you hire to build it.

Key Takeaways

  • Grocery app development runs $45,000 to $280,000 in the US depending on fulfilment model, with a workable MVP from $35,000.
  • A working grocery product needs four surfaces; customer app, picker app, driver app and admin panel, and only two can safely be deferred past v1.
  • Stock accuracy, not the storefront, is what sinks most grocery builds. Substitution and weight-variable pricing have to be designed before the catalogue is.
  • Items sold by weight mean the order total is unknown at checkout, which forces pre-authorisation and delayed capture rather than charge-at-checkout.
  • Accepting SNAP/EBT online requires USDA FNS authorisation, a procurement track that typically adds four to nine months and runs parallel to development.
  • Switching fulfilment models later replaces the inventory, pricing and dispatch layers, which makes the model decision the most expensive one in the project.
  • Timelines run three to twelve months by model, and ongoing maintenance runs 15–20% of build cost per year, with grocery at the top of that band.

What Grocery App Development Actually Covers

A grocery platform is four pieces of software that have to agree with each other in real time.

The customer app handles browsing, cart, checkout and order tracking. The picker app is what store staff carry while they walk the aisles filling the order. The driver app handles assignment, navigation and proof of delivery. The admin panel manages catalogue, pricing, promotions, zones and reporting.

Add a vendor panel if other people’s stores sell through your platform, and you have five.

The general mechanics of connecting buyers, sellers and couriers are shared across categories, and our guide to how on-demand platforms are structured covers that ground. Grocery diverges in three specific places: stock changes faster than in any other category, a meaningful share of items are priced by weight rather than by unit, and a single order can contain sixty line items instead of three.

Those three facts drive almost everything that follows.

The Four Fulfilment Models Behind Every Grocery App

Fulfilment is the question of who owns the stock and who touches it between the order and the door. Four models cover almost every grocery product on the market.

Inventory-owned. You hold the stock in your own stores or a warehouse. Walmart’s grocery operation works this way. You control availability and margin, and you carry the full cost of stock, space and staff.

Marketplace aggregator. You connect customers to stores you do not own. Instacart is the reference. You scale without holding inventory, and you inherit every partner’s stock accuracy problem as your own.

Hyperlocal or dark store. You run small fulfilment sites, closed to the public, positioned for speed. Gopuff built on this. Delivery windows compress to minutes, and the fixed cost arrives before the demand does.

Subscription or replenishment. Customers commit to recurring baskets. Predictable demand, simpler picking, and a much harder acquisition problem.

Model Who Holds Stock Named Example Integration Load Best Fit
Inventory-owned You Walmart Heavy — POS, ERP, stock Existing retailers with stores
Marketplace aggregator Partner stores Instacart Heavy — per-partner catalogue sync Platforms without retail assets
Hyperlocal / dark store You, in micro-sites Gopuff Medium — WMS, dispatch Dense urban zones, funded operators
Subscription You or a 3PL Light — recurring order engine Curated or specialist ranges

Grocery is not food delivery, and the distinction matters more than it looks. A restaurant order is three items from a fixed menu that either exist or do not. A grocery order is sixty items from a catalogue that changes hourly. If you are weighing the two categories, our breakdown of food delivery app development covers what that category needs, and almost none of the inventory problems below apply to it.

Choosing a Fulfilment Model: What It Costs to Change Your Mind Later

Operators change fulfilment model more often than they expect. An aggregator gets tired of partner stock errors and starts holding inventory. A retailer with three stores opens a dark store because one postcode generates a third of its orders.

The migration is where the money goes, because each model puts a different system at the centre of the platform.

Moving From → To Systems Replaced What Survives Proposed Rebuild Cost
Aggregator → Inventory-owned Catalogue sync, availability service, pricing engine Customer app, driver app, accounts $45,000 – $90,000
Inventory-owned → Dark store Picking logic, location model, dispatch zoning Catalogue, payments, customer app $35,000 – $70,000
Aggregator → Dark store Almost the entire fulfilment layer Customer app and accounts only $70,000 – $150,000
Any → Subscription Order engine, billing, basket logic Catalogue, fulfilment, apps $20,000 – $45,000

Two design decisions make these migrations cheaper, and both cost very little at the start. Keep the availability service separate from the catalogue service, so where stock lives can change without the product data changing. And keep pricing in its own layer rather than inside catalogue records, so zone and channel pricing can be reconfigured instead of re-entered.

The most expensive decision in a grocery build is reversible, which is exactly why people make it casually. Teams spend weeks debating native against cross-platform, then settle the fulfilment model in a single meeting. The platform decision affects one surface. The fulfilment decision affects every system behind all of them.

The Four Surfaces a Grocery App Needs (and the Two You Can Defer)

Buyers usually budget for one app and discover three more during scoping. Some of those can genuinely wait.

Surface Job v1 or Deferrable Proposed Cost to Add Later
Customer app Browse, order, track v1 — required $40,000 – $80,000
Admin panel Catalogue, pricing, orders, zones v1 — required $20,000 – $40,000
Picker app In-store picking, substitutions, weights v1 if you hold stock $25,000 – $45,000 — data model is hard to retrofit
Driver app Assignment, navigation, proof of delivery Deferrable $22,000 – $42,000
Vendor panel Partner onboarding and self-service Deferrable to about 20 partners $18,000 – $35,000

The driver app is the most commonly deferred surface, and usually the right one to defer. Third-party courier networks supply their own driver tooling, and your own staff can work from a shared dispatch view for the first few months. What you lose is live location, proof of delivery and route history.

If you are funding a first version and want to understand where the floor sits, the same deferral logic that governs what an MVP costs to build applies here, with the caveat that a grocery MVP starts higher than a general one because the integration work is not optional.

The vendor panel is the other deferrable surface, and the threshold is people rather than volume. Below roughly twenty partner stores, onboarding by hand is annoying but workable. Above it, someone on your team is doing full-time data entry.

For Shop Local Delmarva we built exactly that split: a consumer discovery app on one side, and a web portal on the other where business owners enrol themselves, manage their listings and keep their own information current. Moving enrolment to self-service is what stops partner count from becoming a hiring decision.

Inventory Truth: The Grocery App Development Problem Nobody Scopes

Here is where grocery separates from every other on-demand category. When someone orders a meal, the restaurant either has it or does not, and the answer is known in seconds. When someone orders forty grocery items, the answer changes between the moment they add to cart and the moment a picker reaches the shelf. Stock accuracy is a moving target, and everything downstream depends on it.

where does a grocery app fail and how effective grocery app development can prevent that

Your POS probably cannot answer the question

Most retail point-of-sale systems were built to record what was sold, not to answer what is available right now. Querying them live, per item, per store, at the rate a busy storefront demands, is not what they were designed for.

The workable pattern is a middleware inventory service holding a synced view of stock, which the app reads from. Sync runs on a schedule with a safety buffer so you do not sell the last three units to three customers at once. You accept a small amount of staleness in exchange for a system that does not fall over. Budget $12,000 to $30,000 for that layer, and scope it in week one. It is the most common cause of grocery timelines slipping and it is almost never in the original estimate.

Substitution is a business decision with an engineering bill

An item is out of stock. Something has to happen next, and both options cost money.

Customer-approved substitution needs a live notification, a response window, a default action when nobody replies, and a way to handle the customer who answers after the driver has left. It generates support load.

Automatic substitution needs preference rules, a substitution ranking per product category, and a much stronger refund path for when you get it wrong. It generates refunds.

Neither is wrong. What is wrong is discovering in month five that nobody decided, because the flow touches the customer app, the picker app, the order state machine and the payment logic simultaneously. Either approach costs roughly $8,000 to $18,000 to build properly, and considerably more to bolt on afterwards.

Items priced by weight break the checkout you assumed

Produce, meat, fish and deli are sold by weight. The customer orders about a kilo of tomatoes. The picker puts 1.08 kg in the bag. The price changes at that moment.

This has a consequence most teams meet late: the order total is unknown at checkout. You cannot charge a final amount for a basket whose value has not been determined.

The pattern that works is pre-authorisation at checkout for an estimated total with a headroom margin, then final capture once picking completes and real weights are known. Your payment provider has to support delayed capture and partial capture. Stripe’s authorisation and capture documentation sets out the mechanics, and it is worth confirming support before choosing a provider rather than after. Expect $10,000 to $22,000 for catchweight handling end to end.

If a material share of your catalogue is sold by weight, your payment architecture is decided for you. Pre-authorisation and delayed capture are not an enhancement you add in v2. They change the order state machine, the refund logic and the accounting reconciliation, and retrofitting them means reopening all three.

Grocery App Features That Change the Build, Not the Brochure

Feature lists in this category are usually organised by panel, which tells you what the user sees and nothing about what it costs. Organised by engineering weight, the same list looks different.

  • Light — changes the screen, not the system. Product browsing, search and filters, favourites, order history, ratings, push notifications, promo codes. Typically $1,500 to $6,000 each.
  • Medium — touches the backend meaningfully. Delivery slot selection, multi-store cart, loyalty accrual, recurring orders, driver assignment rules. Typically $8,000 to $20,000 each.
  • Heavy — reshapes the architecture. Real-time inventory sync, substitution workflow, catchweight pricing, multi-vendor settlement, zone-based pricing, demand forecasting. Typically $12,000 to $40,000 each.

Everything in the heavy tier deserves a decision before design starts. Everything in the light tier can be sequenced without much consequence.

Personalised recommendations and demand forecasting now appear on nearly every grocery product, which makes them a baseline expectation rather than a reason to choose you. Budget $15,000 to $40,000 for them and do not expect them to differentiate the product on their own.

On platform choice, the customer app is well served by cross-platform because browsing and checkout are exactly what those frameworks handle well. The picker app deserves separate thought, since barcode scanning and in-store hardware sometimes justify native. It is a per-surface decision, and our breakdown of native versus cross-platform trade-offs applies cleanly.

SNAP, EBT and Alcohol: The US Compliance Layer

Accepting SNAP and EBT online

If you sell food to US households, a meaningful share of your addressable market pays with SNAP benefits. Accepting them online is not a payment integration you switch on. Retailers must be authorised by the USDA Food and Nutrition Service and must work through an approved third-party processor, with the online transaction flow certified separately from in-store acceptance.

Two things follow. The first is timing: authorisation and certification typically add four to nine months and run parallel to development, so the application should be filed at project kickoff rather than near launch. The second is architecture: EBT splits a basket into eligible and ineligible items, which means your cart, tax logic and settlement have to handle a single order paid by two tenders. Budget $15,000 to $35,000 for the integration itself.

The USDA Food and Nutrition Service retailer requirements are the authoritative source and should be checked directly rather than through secondary summaries.

Alcohol delivery and age verification

Alcohol is regulated state by state and sometimes county by county. Delivery may require a separate licence, a specific handoff procedure, ID scanning at the door, refusal logging, and hour-of-day restrictions that differ across your delivery zones.

In build terms this means a per-zone rules engine rather than a global setting, an ID capture flow in the driver app, and an audit trail you can produce on request. Expect $12,000 to $28,000 for compliant alcohol handling, and treat the licensing timeline as a separate track from the software.

Payment security

Card data handling brings PCI DSS obligations. Most grocery operators reduce scope substantially by never touching card data directly and letting a tokenising provider handle it. That decision is worth making explicitly at architecture stage, because the alternative raises both your build cost and your annual compliance burden. Our fintech software development work covers the same payment-architecture ground in more depth.

Requirement Applies To Proposed Lead Time Proposed Build Cost
USDA FNS authorisation for online SNAP Any retailer selling eligible food 4 – 9 months, parallel track $15,000 – $35,000
State alcohol delivery licensing Operators delivering alcohol 2 – 6 months, varies by state $12,000 – $28,000
PCI DSS scope reduction via tokenisation All operators taking cards Concurrent with build Included in payments scope
Age verification and refusal logging Alcohol and restricted items Concurrent with build Included above

USDA authorisation is a lead-time problem, not a code problem. The integration work is measured in weeks and the approval is measured in months, which means the only expensive mistake is filing late. Start the application in discovery, before a single screen is designed.

Integrating With the Systems You Already Run: POS, ERP and Inventory

If you already operate stores, the app is not the hard part. Connecting it to what you run is.

Grocery app integration compared: ten point-to-point connectors versus five through middleware

Four integration surfaces come up almost every time. Point of sale for product data, pricing and transaction records. Inventory or warehouse management for stock levels and movements. ERP for finance, purchasing and supplier data, where one exists. Payments, with the pre-authorisation requirement covered above.

The realistic pattern is a middleware layer owning translation between your systems and the app, rather than point-to-point connections between each pair. Point-to-point looks cheaper for the first two integrations and becomes unmaintainable at the fourth.

We built that pattern for JFA, a B2B parts distributor, where the ordering platform had to keep Stripe payments, invoicing and a NetSuite ERP in agreement across the full order lifecycle. The grocery version of that problem is the same shape with faster-moving data. More of this work sits in our case studies.

Integrating against a system never designed to be queried in real time is a scoping problem long before it is a technical one. The question to answer in discovery is not whether an integration is possible. It is what the system can deliver, how often, and what you do in the gaps.

For operators without any of these systems, the sequence inverts: the app becomes the system of record and you build inventory management inside it. That is a larger build and it is often the right call, because retrofitting a POS around an app you have already shipped is worse.

Grocery Store App Development for Retailers and Chains

If you already run stores, your build is a different project from a founder’s. You have stock, a POS, staff, suppliers and pricing that already works. The app has to fit that reality rather than replace it.

What You Already Run What It Means for the Build Confirm First
A modern cloud POS with an API Fastest path. Middleware sync, weeks not months. Read rate limits and whether stock is exposed per location
A legacy or on-premise POS Add $15,000 – $35,000 and 4 – 8 weeks for a connector or scheduled export Whether the vendor permits third-party access at all
ERP for purchasing and finance Order and settlement data must round-trip, not just push Which system is the source of truth for price
Multiple locations with different pricing Zone and store-level pricing layer required from day one Whether promotions differ by store
Manual or spreadsheet inventory The app becomes the system of record. Larger build, cleaner result. Who owns catalogue maintenance after launch

The single most useful thing a multi-store retailer can do before talking to any development company is check whether stock levels are trustworthy per location. If the answer is no, the first phase of the project is inventory accuracy, not app design, and any partner who does not say so is quoting a template.

Multi-store catalogue and vendor mechanics overlap substantially with general marketplace architecture, which we cover in our guide to building a multi-vendor marketplace platform.

Grocery Delivery App Development: Dispatch, Routing and Last Mile

Delivery is where grocery meets logistics, and the mechanics are borrowed rather than invented.

Four things decide whether the delivery side works. Assignment logic, which decides who takes an order and when. Batching, which groups orders heading the same direction and is where delivery cost per order actually falls. Routing, which sequences stops. And visibility, which is what customers and dispatchers see.

We built the delivery side of that for Lulo Freight, a freight platform where shippers needed real-time visibility and drivers needed a working mobile surface, after their previous development partner left the project incomplete. The lesson that transfers to grocery is that dispatch visibility is a data problem before it is an app problem. If your order records do not carry a clean state machine from picked to en route to delivered, a driver app will not rescue you.

The cost mechanics of dispatch, routing and driver tooling are broken down further in our logistics app development cost guide, and the different categories of logistics software piece covers where a grocery delivery layer sits against full fleet systems.

One decision worth making early: own fleet or third-party couriers. Third-party is faster to launch and more expensive per order. Own fleet costs more upfront and gets cheaper as density rises. Most operators start third-party and move in-house once a zone reaches consistent daily volume.

White Label vs Custom Grocery App Development

White-label grocery platforms are real products and they suit some operators genuinely well. They also carry a migration cost that is rarely discussed at the point of sale.

Criterion White-label Custom Build
Upfront cost $5,000 – $25,000 plus monthly licence $45,000 – $280,000
Time to launch 4 – 10 weeks 3 – 12 months
POS / ERP integration Limited to what the platform supports Built to your systems
Catchweight and substitution Rarely handled well Designed to your rules
SNAP/EBT Depends entirely on the vendor Built in
Ownership You license it You own the code
Migration cost later $30,000 – $80,000 to remodel catalogue, pricing and order history $0 – $20,000 for data migration or architecture changes if required

The honest rule is this. If you are testing whether online grocery works for your business at all, and you have a simple catalogue with few weight-variable items, white-label is a reasonable way to find out cheaply. If you already know the demand exists, hold your own stock, or need SNAP acceptance, the case for starting white-label weakens quickly because you will be paying twice.

Custom does not have to mean everything at once. A phased custom build that starts with the customer app and admin panel, then adds picker and driver surfaces, often lands close to white-label’s first-year cost while leaving you with an asset you own.

How Much Does It Cost to Develop a Grocery App?

A grocery app costs $45,000 to $280,000 to build in the US. A workable first version starts at $35,000. The spread is that wide because the fulfilment model, not the feature list, decides most of the number.

Cost by fulfilment model

Fulfilment Model What the Build Includes Proposed Cost Proposed Timeline
Subscription / replenishment Customer app, admin panel, recurring order engine, payments $45,000 – $85,000 3 – 5 months
Marketplace aggregator Customer app, admin, vendor panel, per-partner catalogue sync, dispatch $80,000 – $160,000 5 – 8 months
Inventory-owned (existing stores) Customer app, picker app, admin, POS and inventory integration, catchweight, substitution $90,000 – $180,000 6 – 9 months
Hyperlocal / dark store All of the above plus WMS, zone logic, compressed dispatch $140,000 – $280,000 9 – 12 months

Cost by component

If you are phasing the build, these are the individual pieces.

Component Proposed Cost
Customer app, iOS and Android via cross-platform $22,000 – $45,000
Admin panel $15,000 – $30,000
Picker app $18,000 – $35,000
Driver app $20,000 – $40,000
Vendor panel $15,000 – $32,000
Real-time inventory middleware $12,000 – $30,000
Substitution workflow $8,000 – $18,000
Catchweight pricing and delayed capture $10,000 – $22,000
SNAP/EBT integration $15,000 – $35,000
Multi-vendor settlement and payouts $12,000 – $28,000
Loyalty programme $8,000 – $20,000
AI recommendations and demand forecasting $15,000 – $40,000
Ongoing maintenance, per year 15–20% of build cost

 Why quotes for the same brief vary so widely

Directories listing grocery app development companies publish a median hourly rate around $37. US onshore teams bill three to five times that. Both numbers are real, and the difference is not margin.

Rate Band Typically What Changes
$25 – $45 / hr Offshore delivery teams Lowest sticker price. Retail systems experience and US compliance knowledge vary widely. Timezone gap affects integration work most, because POS debugging is interactive.
$50 – $85 / hr Nearshore or hybrid Overlap hours improve. Often the best value where the scope is well defined before work starts.
$100 – $175 / hr US-based or US-led hybrid Full overlap, direct accountability, familiarity with USDA and state-level requirements. This is the band our model figures above assume.
$175 – $300 / hr Enterprise consultancies Procurement-grade process and documentation. Justified for multi-country or heavily regulated programmes.

The useful question is not which band is cheapest per hour. It is which band delivers the integration and compliance work without a second engagement to fix it. The rate-band question applies across all categories, and our guide to what it costs to hire an app development company covers the trade-offs in general terms.

For how these bands compare against app development generally, see our mobile app development cost breakdown. If you want a figure against your own scope rather than a range, run the cost calculator before the first vendor conversation.

Scope your grocery build around what you already run

A scoping conversation starts with your fulfilment model, your POS and your stock accuracy, not a feature list. You will leave with a surface list, an integration list and a realistic band, whether or not you work with us.

How Do Grocery Apps Make Money?

Grocery apps make money from delivery fees, basket minimums, subscription memberships, partner commission, and retail media. Most operators run three or four of these at once, because grocery margin is thin enough that a single revenue line rarely covers fulfilment cost.

Revenue Line How It Works Typical Share of Revenue
Delivery and service fees Per-order charge, often scaled by basket size or slot demand Largest single line for most delivery-first operators
Subscription membership Flat monthly or annual fee waiving delivery charges Smaller, but the strongest retention lever
Partner commission Percentage of basket value from stores selling through a marketplace Primary line for aggregators
Retail media Suppliers pay for placement, sponsored search and promotions Highest margin line, needs scale before it works
Markup on catalogue price Online price set above shelf price Common and quietly significant for aggregators

 Whether owning a grocery app is actually profitable

The honest answer is that grocery delivery is structurally hard to make profitable on delivery fees alone, and the operators who do well add a second and third revenue line early. Retail media is the one that changes the arithmetic most, because supplier-funded placement carries almost no marginal cost. It also needs order volume before suppliers will pay for it, which makes it a year-two lever rather than a launch plan.

Two numbers decide the outcome before any of this matters. Basket size has to clear the cost of picking and delivering it, which is why basket minimums exist. And order density per delivery zone determines whether batching works, which is the single biggest factor in cost per delivery.

An operator with fewer, larger orders concentrated in a tight zone will usually beat one with more orders spread thinly. That is a decision about where you launch, not about what you build, and it is worth settling before the app scope is fixed.

Order density beats order count. A grocery operation doing 200 orders a day inside three postcodes can batch, route efficiently and pay a driver properly. The same 200 orders spread across a city cannot, and no amount of routing software fixes it. Pick the zone before you pick the feature set.

 How to Develop a Grocery App: The Sequence That Works

The order of operations matters more in grocery than in most categories, because the expensive decisions sit early and the visible work sits late.

Phase What Happens Proposed Duration
1. Discovery and model selection Fulfilment model chosen, integration audit, surface scope, SNAP application filed if relevant 2 – 4 weeks
2. Integration and data design Catalogue model, availability service, substitution rules, capture logic, pricing layer 3 – 6 weeks
3. Build Customer app and admin first, then picker, then driver 12 – 24 weeks
4. Pilot store One location, limited catalogue, capped daily orders, real pickers 4 – 6 weeks
5. Rollout Store by store, zone by zone, with capacity tuned per zone 4 – 12 weeks

The pilot phase is the one that gets cut when a timeline tightens, and cutting it is expensive. A single store running real orders for two weeks surfaces substitution disputes, weight discrepancies and picker workflow problems that no amount of QA finds, because they are operational rather than technical.

Run it with deliberate constraints. One store, limited catalogue, capped daily orders, and staff who will tell you what is annoying. The broader delivery sequence for any mobile product is covered in our mobile app development guide, and grocery follows it with two additions: the integration phase comes before the build rather than during it, and the pilot is non-negotiable.

Delivery Slots, Zone Pricing and Capacity: Lessons From a Multi-Role Platform Build

Two of the hardest mechanics in grocery are not grocery-specific, which means you can learn them from platforms in other industries.

The first is capacity. A delivery slot is a finite resource shared between customers who want it, staff who service it, and a business that needs it filled evenly rather than in spikes. Oversell it and you fail orders. Undersell it and you pay for idle staff.

The second is pricing that varies by context. Delivery fees changing by zone, basket value, time of day and demand are a configuration problem, and the moment they live in code rather than a configurable layer, every promotion becomes a release.

We built both for a multi-role US property-services platform; resident app, service-provider mobile app, property-manager portal and admin, all on one system. The two modules that mattered most were a capacity management system balancing workload across providers against real availability, and a pricing configurator adjusting service and add-on pricing dynamically by market and property attributes rather than through hard-coded rates.

That platform now manages 6,477 properties with more than 685,000 customers onboarded, supported by 67 service providers across 7,581 property management companies.

The mechanics transfer directly. Service providers map to pickers and drivers. Property attributes map to delivery zones and basket composition. The lesson is the same in both contexts: build capacity and pricing as configurable services on day one, because the alternative is a code deployment every time operations wants to change a fee.

How to Choose a Grocery App Development Company

The criteria that matter in this category are narrower than a generic vendor checklist suggests. Five questions separate companies that have built grocery from companies that have built apps.

Ask What Good Looks Like Red Flag
What would you integrate with first? They ask about your POS, stock accuracy and catchweight share before discussing screens They start with the storefront and UI
How do you handle substitution? They explain the trade-off between support load and refunds and ask which you prefer They call it a feature and move on
What would you defer from v1? They ask about your courier arrangement before quoting four surfaces A four-app quote with no questions
What does the pilot look like? One store, limited catalogue, capped orders, defined exit criteria QA straight to multi-store rollout
Who owns the code and the data? Unambiguous, in writing, including third-party accounts Vague answers or platform lock-in

Engagement models and where risk sits

Model Best For Risk Sits With
Fixed price Tightly defined scope, usually phase 1 only The vendor, who prices that risk in
Time and materials Integration-heavy work where discovery changes things You — requires active involvement
Dedicated team Multi-phase programmes past six months Shared, with you owning direction
Phased fixed price Most grocery builds. Fixed per phase, re-scoped between Balanced. Usually the right default here.

One practical note on quotes. If three companies return wildly different numbers for the same brief, the brief was not specific enough about integration. Grocery quotes diverge on what the vendor assumed about your POS, not on their hourly rate. Give every vendor the same integration detail and the spread narrows sharply.

Conclusion

The fulfilment model is the decision that matters. It sets your integration list, your surface count and most of your budget, and every other choice in this guide follows from it. Operators who settle it deliberately in discovery spend less overall than those who start from a feature list and meet the implications in month four.

If you already hold stock and run a POS, you are closer to a working grocery product than you probably think. The real work sits in inventory accuracy rather than the storefront, and the first phase should confirm your stock data is trustworthy per location before anyone designs a screen.

If you are aggregating other people’s stores, the work sits in vendor onboarding and dispatch instead. Your stock accuracy problem becomes your partners’ stock accuracy problem, which is harder to solve because you do not control it.

Either way, three things decide how the project goes: the model you pick, how much of your catalogue is sold by weight, and how early you file for the approvals you need. Substitution flows, catchweight pricing and a late USDA application account for most of the overruns in this category.

A scoping conversation gets short once you can answer those three questions. Bring them to any development company and the quotes you get back will finally be comparable.

Pressure-test the budget you have in mind

Five questions, and you get a band tied to your fulfilment model rather than a generic app estimate.

Run the cost calculator

Code Audit: What It Covers, What It Costs, and the Decision It Should Give You

A code audit is an independent examination of a codebase carried out by someone who did not build it. It looks at the source code, the third-party packages it depends on, the configuration, the architecture and the test coverage, and it reports what is sound, what is fragile and what is dangerous.

I sit with founders and CTOs at the moment they decide to commission one, and the conversation almost never starts with the word audit. It starts with a problem. Someone inherited a product and cannot tell what they own. A vendor has gone quiet. An investor has asked a question nobody can answer.

This piece covers what an audit examines, when it is worth doing, what a good report contains, what it costs, and the decision it should leave you holding at the end.

Key Takeaways

  • A code audit is an independent examination of a codebase: It covers the code, dependencies, configuration, architecture and tests, and is performed by someone who did not write the system.
  • An audit and a code review are different jobs: Reviews happen continuously during development and are performed by the team; an audit happens at a decision point and is performed independently.
  • The output should be a decision, not just a list: A useful audit should tell you whether to refactor, rebuild one layer or start again. A report that stops at findings has done only half the work.
  • The data model often decides refactor versus rewrite: If the architecture holds and the failures sit in access control, validation and error handling, hardening usually wins. If the underlying schema is wrong, fixes built on top of it may have to be redone.
  • Independence is what makes an audit an audit: IEEE 1028 defines a software audit as an examination by people outside the development organisation. Asking the team that wrote the code to grade it removes the independent assessment the audit is intended to provide.
  • Budget $3,000–$8,000 for a first-pass audit: A focused review typically takes 1–2 weeks; a full architectural audit covering deeper architecture, dependencies, security and technical debt can run $10,000–$25,000.

What Is a Code Audit?

A code audit is a structured, independent assessment of software quality, security and maintainability. The auditor reads the codebase, runs analysis tooling against it, examines how it is deployed, and produces a written account of its condition with findings ranked by severity.

The word independent is doing real work in that sentence. IEEE 1028, the standard that defines software audits, describes them as examinations conducted by personnel outside the development organization. That separation is the mechanism.

The scope varies. A source code audit focuses on the code itself. A security code audit prioritizes exploitable weaknesses. An architectural audit asks whether the structure can carry where the business is going. Most of the audits I see are a blend, weighted toward whichever question triggered them.

What a Code Audit Actually Examines

Six layers, and skipping any of them produces a report that reads well and misses the expensive problem.

  • The source code. Readability, duplication, complexity, naming, dead code, and whether the same logic has been implemented in four places.
  • Every third-party package resolved to a real registry entry, checked for known vulnerabilities, abandonment and licence obligations that propagate.
  • Configuration and secrets. Environment handling, and a scan of the full commit history rather than the current state. Keys removed last year are still in the history.
  • How the pieces fit, where the coupling is, and whether the data model supports the roadmap or fights it.
  • Security controls. Authentication, authorisation, input validation, encryption, and access rules tested with a low-permission account rather than an admin one.
  • Tests and documentation. Coverage, whether the tests assert anything meaningful, and whether a new engineer could get productive without an oral history.

A website code audit tends to weight the first three layers more heavily. For a customer-facing mobile product, the audit also needs to consider how the app, backend, APIs, and third-party services work together. That becomes especially important when an existing app needs to be maintained, modernized, or extended rather than replaced. Our mobile app development services cover these broader application layers as part of the development process.

If the product was assembled on a low-code or no-code platform, the questions change again — the platform owns some of these layers on your behalf, which helps until it does not. We covered the data on that in our low-code and no-code statistics.

Code Audit vs Code Review vs Penetration Test

These three get used interchangeably and they answer different questions. Confusing them is how teams end up believing they are covered when they are not.

Practice What It Asks When Who Runs It What You Get
Code review Does this change work and fit our standards? Every pull request Your own team Logic and style corrections before merge
Code audit What condition is this codebase in, and what should we do about it? At a decision point Someone independent of the build A ranked findings report and a recommendation
Penetration test Can this running system be broken into? After deployment A security specialist Proven exploit paths in a live environment

Reviews catch problems one change at a time and cannot see the shape of the whole. A pen test finds what is exploitable today and says nothing about whether the codebase can carry another two years of features.

An audit is the only one of the three that answers a business question. That is why it is the one that gets commissioned by someone who is not an engineer.

Five Situations That Should Trigger a Code Audit

Nobody wakes up wanting an audit. Something happens first. In my experience it is almost always one of these five.

  1. You inherited a codebase you did not build

An acquisition closed, a technical co-founder left, or you took over as CTO. You now own software that works, and no one can tell you how it works or where it is fragile.

This is the most common trigger and the one where an audit pays for itself fastest, because every roadmap decision you make until then is a guess.

  1. Your development vendor is leaving

A contract is ending, a relationship has soured, or you are moving the work in-house. The handover documentation is thin and the people who know the system are about to stop answering the phone.

Audit before the transition rather than after it. The outgoing team can still answer questions, and the findings change what you should ask for in the handover. The same logic applies when you are choosing how the next engagement is structured.

  1. You are raising, selling or acquiring

Technical due diligence is now standard in most funding rounds and every acquisition. Someone on the other side of the table will read your code, and what they find will move the number.

Running your own audit first means you control the sequence. You get to fix the embarrassing things, and you get to explain the rest in your own words instead of defending a stranger’s summary of them.

  1. Your MVP is buckling under real usage

The product found users and the codebase was built to prove an idea rather than carry a business. Releases are getting slower, bugs are recurring, and the team is asking for a rewrite.

An audit is what separates a rewrite that is genuinely necessary from a rewrite that is an engineering preference. Those two look identical from the outside and cost very different amounts.

  1. You cannot verify what you paid for

You commissioned a build, you received something that runs, and you have no way to judge whether it is sound. The demo worked. That is the entire basis of your confidence.

This has become more common as more of what gets delivered is generated rather than written. If a large share of your codebase came out of an AI assistant, there is  a specific set of things to check that a general audit will not prioritize on its own.

What a Code Audit Report Should Tell You

Most audit reports I get shown are inventories. Pages of findings, severity labels, and a tooling summary. That is evidence rather than an answer, and it leaves the hardest part of the job with the person least equipped to do it.

Ask for these four outputs before the engagement starts. Put them in the statement of work.

  1. A plain-language condition summary. Two paragraphs a non-technical director can read and act on. If the auditor cannot write that, they have not finished thinking.
  2. Findings ranked by business consequence, not just severity. A critical flaw in a feature nobody uses matters less than a moderate one in checkout. Severity scores do not know that. Your auditor should.
  3. A remediation sequence with effort attached. What to fix first, what can wait, roughly how long each takes, and what depends on what.
  4. An explicit recommendation. Refactor, rebuild a layer, or rewrite. With the reasoning, so you can disagree with it on the merits.

A code audit report that contains all four is worth several times one that contains only the first three, and it rarely costs more. It is a scoping decision rather than a pricing one.

Do you need a code audit?

Five questions. Nothing is sent anywhere, and you are not asked for an email.

Refactor, Rebuild or Rewrite: Reading the Result

This is the decision the whole exercise exists to produce, and there is a reasonably reliable rule behind it.

The data model decides. If the schema and the core domain logic are sound, almost everything else is repairable in place. If the data model is wrong, every fix layered on top of it has to be redone when you eventually correct it.

Signal Refactor Rebuild One Layer Full Rewrite
Data model Sound Sound Wrong at the core
Where failures sit Access control, validation, error handling One layer, usually the backend or data access Throughout, and they trace back to structure
Can a new engineer work in it? Yes, with effort In parts No
Test coverage Present, needs extending Thin in the affected layer Absent or meaningless
Typical outcome Same codebase, materially safer Interface kept, foundation replaced New system, migrated data

Two warnings from watching this go wrong.

A full rewrite is the most expensive option and the most frequently chosen for the wrong reasons. Engineers dislike inherited code, and that dislike is honest but it is not evidence. Ask what specifically cannot be fixed in place.

Refactoring is also over-prescribed, usually to avoid a difficult budget conversation. Patching a broken foundation defers the cost and increases it. The way through is to put a number on the interest you are paying, which is the exercise in our piece on AI technical debt.

Where a rewrite is genuinely the answer, the next question is whether to build again or buy something off the shelf. We work through that trade-off in SaaS versus custom software , and it is the point at which custom software development becomes a scoping conversation rather than a theoretical one.

Not sure which of the three you are looking at?

A scoped first-pass audit answers that before you commit a rebuild budget. You get the findings and the recommendation, not a proposal.

Book a code audit conversation

Who Should Run Your Code Audit

Three options, and they are not equivalent.

Your own team is the cheapest and the least useful. They know the system better than anyone, which is the problem. People cannot see the decisions they have stopped noticing, and nobody grades their own work harshly enough to be worth paying for.

The vendor who built it is the option I argue against most often. Asking the team that wrote the code to tell you whether the code is good removes the independence that gives an audit its value. Even with the best intentions on both sides, the incentive is wrong.

An independent third party is the answer in almost every case. Someone with no stake in the previous decisions and no revenue attached to the conclusion.

When you are choosing an independent code audit company, four things matter more than the brochure:

  • They build software as well as assess it. Auditors who do not ship struggle to estimate remediation effort realistically.
  • They will write the recommendation down, including a recommendation not to spend money with them.
  • They have worked in your stack. Generic findings come from generic tooling.
  • They will name the engineer doing the work, not just the firm.

That last one catches more problems than the other three combined. The fuller version of this vetting logic sits in our guide to how to evaluate a development partner.

What a Code Audit Costs

Cost tracks scope, codebase size and how much of the work is manual. Automated scanning is cheap and finds the patterned problems. Human reading is expensive and finds the ones that matter.

Four things drive the number:

  • Lines of code and the number of services involved.
  • How much of the review is manual rather than tool-driven.
  • Whether architecture and data modelling are in scope or only the code.
  • Whether you need a remediation plan with effort estimates, or only findings.
Audit depth What it covers Typical range Timeline
Automated scan only Static analysis, dependency and secrets scanning, a raw findings list $500–$2,000 2–5 days
First-pass audit Automated scanning plus manual review of high-risk areas, condition summary, ranked findings, a recommendation $3,000–$8,000 1–2 weeks
Full technical audit Everything above plus architecture and data model assessment, test coverage analysis, remediation sequence with effort estimates $10,000–$25,000 2–4 weeks
Due diligence audit Full audit written for an investor or acquirer, with the disclosure framing that audience expects $15,000–$40,000+ 3–6 weeks

Set the cost against what it prevents rather than against your development budget. An audit that redirects a rewrite into a targeted rebuild pays for itself several times over, and our app development cost calculator  gives you a rough sense of what a full rebuild would run for comparison.

What to Do in the First 30 Days After an Audit

A report that sits in a folder has cost you money and changed nothing. Three phases, and the whole thing fits inside a month.

Days 1 to 7: triage

Fix anything exposed right now. Exposed secrets get rotated, publicly accessible data gets closed, and known-exploited dependency versions get upgraded. These are usually hours of work, not weeks.

Then decide, in writing, which findings you are accepting and not fixing. Recorded acceptance is a different thing from an oversight.

Days 8 to 21: decide

Take the recommendation to whoever holds the budget with a number attached to each of the three options. Refactor, rebuild a layer, rewrite. Pick one and write down why.

Bring an engineer who disagrees into that meeting. The decision improves and it stops being one person’s opinion.

Days 22 to 30: sequence

Convert the remediation list into roadmap items with owners and dates, and protect a share of each cycle for it. Work that lives outside the plan does not happen.

Then set the re-audit trigger. Tie it to change volume rather than the calendar, a major architectural change, a new team taking over, or a funding event. We have taken over projects where the second audit found less than the first, which is what the process working looks like.

Conclusion

If one of the five situations described your week, you already know the answer. The remaining question is depth, and that depends on whether you need to know the code is safe or need to decide what to do with it.

Commission the audit before the decision rather than after it. I have watched teams approve a rewrite budget and then run an audit that would have saved most of it, and the order is the only thing that went wrong.

Ask for the four report outputs. Insist on someone independent. And treat a recommendation you did not want to hear as the thing you paid for.

Find out what you actually own

An independent audit tells you whether to refactor, rebuild one layer, or start again, with the reasoning and the numbers behind it.


Explore our legacy software modernization services