








AI-Generated Code Security Risks: What Breaks, What It Costs to Fix, and How to Verify It

The security risks of AI-generated code concentrate in four places: input handling, cryptography, access control, and dependencies. Veracode’s 2026 GenAI Code Security Report tested more than 100 large language models across 80 code-completion tasks and found security has stalled at a 56% pass rate. Models fail hardest on the ordinary weaknesses, missing cross-site scripting defences (CWE-80) in 86% of cases and log injection defences (CWE-117) in 88%. They also invent third-party package names that attackers then register on npm and PyPI.

I lead AI transformation at AppVerticals, and most of the people who call me about this are not security engineers. They are founders and CTOs with a working product, a codebase a model wrote a large share of, and a launch date already promised to someone.

This piece is written for them. What actually breaks, what it costs to fix, and what evidence to ask for before you accept a delivery.

Key Takeaways

  • Security has stalled: Veracode’s 2026 GenAI Code Security Report puts AI-generated code at a 56% security pass rate, roughly flat against 2025. Capability improved, but safety did not.
  • Coding-tuned models are no safer: They average a 51% pass rate versus 52% for general-purpose models, while model size shows no measurable security advantage.
  • The failures are ordinary: Models miss cross-site scripting defences (CWE-80) in 86% of cases and log injection defences (CWE-117) in 88%, while handling SQL injection comparatively well.
  • Invented packages create a newer supply-chain risk: Models can recommend third-party libraries that do not exist. Attackers can register those names on npm or PyPI, making a malicious dependency look legitimate during review.
  • Three tiers need three responses: AI-assisted code in a reviewed pipeline, a prompt-generated app, and agent-written code have different failure modes, so one remediation plan will not address all three effectively.
  • Hardening is cheaper than starting over: Security hardening for an AI-generated MVP typically runs around $15,000–$35,000 over 3–6 weeks; a full rebuild can start at $40,000+ when the codebase requires structural replacement rather than targeted remediation.

What Are the Security Risks of AI-Generated Code?

The security risks of AI-generated code are weaknesses a language model introduces because it optimises for code that looks right rather than code that is safe. The four recurring categories are unvalidated input handling, weak or misapplied cryptography, missing access control, and dependencies that were never verified. They pass tests and compile cleanly, which is what makes them hard to catch.

That last point is the one I keep coming back to. A missing permission check does not throw an error. An unescaped output does not fail a build. The code runs, the demo goes well, and the weakness sits there until someone goes looking or something goes wrong.

So the honest framing is that speed moved and verification did not. The generation step got dramatically faster. Reading, testing, threat-modelling and reviewing take exactly as long as they always did.

Why AI Writes Insecure Code: Three Root Causes

Three things drive almost everything I find in these codebases. They are worth understanding because each one points at a different control.

  1. The training data carries the flaws

These models learned from public repositories, documentation and forum answers. That corpus contains excellent code and it also contains deprecated functions, insecure patterns and examples written to demonstrate a concept rather than to ship.

A model reproducing a common pattern will reproduce a commonly insecure one at roughly the rate it appears. Popularity in the training data is not a proxy for safety.

  1. The model cannot see your architecture

A language model works from the text in front of it, which is a fraction of your system. It does not know your naming conventions, your permission model, your data classification, or the compliance constraint your legal team agreed to last quarter.

So it fills the gap with a generic pattern that fits a generic application. That is the mechanism behind most missing access control I see. The model wrote a working endpoint for an application it was never shown.

  1. Security is rarely what the prompt asked for

Models optimise for a plausible, useful answer to the request as stated. Almost nobody types “and make sure the output is escaped.” Security is implicit in the request and explicit in nothing, so it gets treated as optional detail.

This is the same root cause behind the broader problems with how AI is used across the software development lifecycle. The model is answering the question you asked, and security was not in it.

The Vulnerability Classes AI Introduces Most Often

The pattern in the research is consistent. Models do reasonably well on weaknesses with one obvious defensive move and badly on weaknesses that require understanding how data travels through an application.

CWE numbers below refer to MITRE’s Common Weakness Enumeration, the standard catalogue security teams use to classify software flaws.

Weakness What It Allows Model Performance Why Models Miss It
Cross-site scripting (CWE-80) Attacker-supplied script runs in another user’s browser session Fails ~86% of the time Requires knowing which variables reach a page and need escaping, which depends on application context the model cannot see
Log injection (CWE-117) Forged or manipulated log entries that hide activity or mislead an investigation Fails ~88% of the time Logging looks harmless, so sanitising what goes into it is rarely treated as a security step
SQL injection (CWE-89) Direct manipulation of database queries ~80% pass rate One well-known fix (parameterised queries) appears constantly in training data
Broken cryptography (CWE-327) Sensitive data protected by an algorithm that no longer holds up ~86% pass rate Usually fine, but the remaining cases pick an outdated algorithm that was standard when the training data was written
Hard-coded credentials (CWE-798) Keys and passwords readable by anyone with repository access Common, particularly in some model families A password in a string literal looks like any other string
Missing access control Users seeing or changing records that belong to someone else Frequent in generated applications An absent check is not a pattern a model can be prompted to avoid; nothing in the request asks for it

Language matters too. Java has consistently shown the highest failure rates in the Veracode testing, which puts large enterprises with Java back ends in the most exposed position.

Hallucinated Dependencies and the Slopsquatting Problem

This is the risk that has no equivalent in hand-written code, and it is the one I would flag first to any team shipping AI-assisted work.

Ask a model to handle a common task and it will often recommend a third-party library. Sometimes that library does not exist. The model produced a name that fits the naming conventions of the ecosystem, and it reads as entirely plausible.

Attackers watch for these invented names and register them on public registries like npm and PyPI, filled with whatever they want to run on your machine. The industry has settled on calling this slopsquatting.

What makes it dangerous is that the import line looks correct in review. A reviewer scanning a diff sees a sensibly named package doing a sensible thing. The control that catches it is resolving every dependency against a real, dated registry entry, not reading the code.

What the 2026 Data Shows: Security Has Stalled, Not Improved

The reasonable assumption is that this problem is solving itself as models improve. The measurement says otherwise.

Veracode has run the same test each year: 80 code-completion tasks with known potential for security weaknesses, across more than 100 models, with no security-specific prompting. The 2026 GenAI Code Security Report found the pass rate sitting at 56%. Roughly two in five samples still carry a known weakness out of the box.

Two findings in the 2026 report change how I advise teams on tool selection. Models built specifically for writing code averaged a 51% security pass rate against 52% for general-purpose models. And size made no difference: large models scored 53%, medium and small both 51%. Buying a coding-specialized assistant buys you speed. It does not buy you a safer starting point, and teams that assume otherwise ship vulnerable code at the same rate as everyone else.

The one architectural factor that helped was reasoning capability. That is a useful signal, and it is a long way from a solved problem.

I read this as a planning input rather than an argument against the tools. Adoption is going up and the safety floor is holding still, which means the review burden scales with output. Plan for it now.

Assisted, Generated, Autonomous: Three Risk Tiers, Not One Problem

Most advice on this topic treats “AI-generated code” as a single condition. In practice I see three, and they fail differently enough that one remediation plan will underdeliver on all three.

Tier What It Is Typical Origin Dominant Failure What It Needs
Tier 1 — Assisted A developer accepts model suggestions inside a normal codebase Copilot, Cursor or Claude Code in an existing repo Duplication, near-miss logic, weaknesses that pass a fast review A written review standard and a cap on changeset size
Tier 2 — Generated A working application produced mostly from prompts, with no engineering pipeline behind it Prompt-to-app builders Missing access control, unhandled failure states, backend that was never designed Backend and permission model rebuilt before real users arrive
Tier 3 — Autonomous An agent making multi-file changes and running commands Agentic coding tools with broad permissions Wide-blast-radius changes, permissions still set to prototype scope Least-privilege scoping and human approval on consequential actions

Tier 1 is the least alarming and the most common. The code sits in a real repository with real tests, and the problem is volume against review capacity.

Tier 2 is where I find the serious issues. When applications built this way have been scanned at scale across thousands of vibe-coded apps, the recurring findings are exposed secrets and access rules that were never enforced. The interface is usually the strongest layer and the backend is usually the weakest.

This is why I treat vibe coding for mobile app development as a validation route rather than a delivery route. It is excellent for proving an idea and it does not produce a backend you should put customer data in.

Tier 3 is newest and moves fastest. As teams adopt agentic AI software development, the permission scope granted during a prototype tends to survive into production, and the cost of a wrong decision scales with the breadth of what the agent is allowed to touch.

What It Costs to Secure an AI-Generated Codebase

This is the question everyone actually calls about, and it is the one with the least published guidance. The answer depends almost entirely on which tier you are in and whether the data model underneath is sound.

Here is how I scope it.

Scope What It Covers Typical Range Timeline
First-pass security review Static analysis on the delivered branch, dependency resolution, access-rule testing with a non-admin account, secrets scan across full commit history, written findings list $3,000–$8,000 1–2 weeks
Access control and backend hardening Enforcing row-level security, correcting role logic, adding the failure states the application never had $8,000–$20,000 2–5 weeks
Dependency and supply-chain cleanup Resolving every package to a real registry entry, removing invented or abandoned libraries, licence inventory $3,000–$10,000 1–3 weeks
Targeted rebuild of the unsafe layer Replacing the backend or the data-access layer while keeping the interface $20,000–$60,000 4–10 weeks
Full rebuild Where the data model itself is wrong and every fix on top of it would be redone later $40,000–$150,000+ 3–6+ months

One decision drives most of the cost. Hardening works when the architecture is sound and the failures sit in access control, validation and error handling. A rebuild becomes cheaper when the data model is wrong, because every fix layered on a broken schema gets redone later anyway.

The wider bill here is AI technical debt, which covers how to score your exposure across both generated code and production AI systems and put an annual figure against it. Security is one of three places that debt lands.

Not sure whether to harden or rebuild?

A first-pass review scopes the work before you commit to either. You get the findings and the estimate, not a proposal.

Book a code review 

The Acceptance Gate: What to Demand Before You Accept AI-Generated Code

If you are commissioning a build rather than writing it, this section is the one that saves you money. Almost every remediation project I take on could have been avoided by asking for evidence at handover.

Ask for these eight things as deliverables. A capable partner will produce them without friction.

  1. A written statement of which components were AI-generated and with which tools.
  2. Static analysis output run on the delivered branch, not on a clean sample.
  3. A dependency manifest with every package resolved to a real, dated registry entry.
  4. Evidence that access rules were tested with a lower-permission account, not just an admin.
  5. Documented behaviour for failure states: failed login, denied permission, empty data, failed payment.
  6. A named engineer who can explain any module on request.
  7. Secrets scanning results across the full commit history, not just the current head.
  8. A written list of what was found and deliberately not fixed, with the reasoning.

That last one matters more than it looks. Every project has accepted risks. The difference between a healthy delivery and a bad one is whether those risks were decided or discovered.

The threshold question comes up on every board eventually. Coinbase CEO Brian Armstrong disclosed publicly that roughly 40% of the exchange’s code output was AI-written and defended it on the condition that everything gets reviewed and understood. Larry Lyu, founder of the decentralized exchange Dango, called that level of reliance a serious concern for any security-sensitive business. Both positions are defensible, and the disagreement is really about whether the review capacity kept pace with the generation. That is the number I would want, rather than the percentage itself.

There is a fuller vetting checklist in our guide to how to evaluate an AI development company which covers the process questions alongside these evidence requirements.

Where OWASP and NIST Guidance Actually Applies

Two standards come up constantly in these conversations, and it helps to be precise about what each one does.

The owasp.org is a ranked list of the most critical web application security risks. It is the right vocabulary for classifying what a review finds, and the weaknesses in the table above map onto it directly. It does not tell you anything specific about generated code, because the flaws are the same old flaws arriving by a new route.

The NIST Secure Software Development Framework  is the more useful reference for this problem. It describes the practices a development process should contain — reviewing code, protecting the toolchain, verifying third-party components, without prescribing tools. Every one of those practices is exactly what gets skipped when generation outpaces review.

So the practical read is that neither standard needs an AI-specific edition for you to act. Generated code breaks the same controls the frameworks already ask for, and the gap in an audit will be written up as a change-management failure rather than an AI problem.

Where AI does need its own treatment is agent permissions and model oversight, which is what our AI governance services put in place before a system reaches production traffic.

The coupling you accept at the start also shapes how much of this you can control later, which is the argument underneath building your own model versus calling an API. 

AI-Generated Code Security Risks in Regulated Builds

Healthcare, fintech and anything handling regulated data change the calculation in one specific way. The controls are not stricter because AI wrote the code. They were always this strict, and generated code makes them easier to skip.

An auditor will ask how a change reached production and what evidence exists that it was reviewed. If AI-suggested changes merged without a documented review, the finding lands against your change-management control and the AI is incidental to it.

My working rule for regulated builds is that generated code gets a stricter review than hand-written code, rather than an equal one. A person wrote the hand-written line and can explain the reasoning. Nobody has yet reasoned through the generated one.

Where to Start

The decision in front of you is smaller than the problem sounds. You do not need a position on whether AI belongs in your codebase, because it is already there. You need to know which of the three tiers you are in, and the six questions above will settle that in an afternoon.

What follows from the answer is straightforward. Tier 1 needs a review standard written down and enforced. Tier 2 needs the backend and the access rules rebuilt before real users touch them. Tier 3 needs permission scopes narrowed before the next agent run.

All three need someone who can explain the code, and that is the requirement no tool satisfies on your behalf.

The teams that get burned are the ones who accepted a delivery that compiled, passed, and had never been read.

Find out what your AI-generated code is actually carrying

Our engineering team reviews the codebase, tests the access rules, resolves every dependency, and hands you a written list of what to fix and what to rebuild.


Explore our mobile app development services

Dedicated Development Team: Cost, Structure, and Ramp Time

A dedicated development team is an engagement model where a vendor assembles a cross-functional group (engineers, QA, a delivery lead, and often a business analyst or DevOps engineer) that works exclusively on your product and bills as a monthly retainer rather than per deliverable. You direct the backlog. The vendor carries recruitment, payroll and replacement.

A five-person offshore pod typically runs $18,000 to $32,000 a month, reaches predictable sprint velocity in six to eight weeks, and earns that retainer only if you can keep it supplied with groomed work.

Below is what sits inside the team and what each role owns, what three real pod compositions cost per month, what weeks one to twelve actually deliver, how the statement of work should handle IP assignment and notice periods, and a scored test that tells you whether a dedicated team is the right call for where you are right now.

Key Takeaways

  • A dedicated team buys capacity and continuity: You pay a monthly retainer for a fixed group of people rather than paying per feature, giving you an ongoing development team.
  • A five-person offshore pod costs $18,000–$32,000 per month: This includes a delivery lead and QA; engineer-only rate cards can understate the true cost of a self-managing team.
  • Plan for six to eight weeks to reach full velocity: Vendors may quote days to staff a team, but output typically takes longer to become predictable as the team learns the product, processes, and backlog.
  • Backlog readiness matters as much as engineering capacity: Budget around 8–10 hours of product-owner time each week and keep two sprints of groomed work ready to avoid starving the team of usable work.
  • Choose the model based on your roadmap: Dedicated teams fit evolving roadmaps and engagements beyond six months; fixed price works better for locked scope, while staff augmentation suits teams that already have product management and delivery capacity.
  • Define what “dedicated” means in the contract: A replacement SLA, named key-person commitment, and handover overlap period provide practical continuity beyond the label itself.

What Is a Dedicated Development Team?

A dedicated development team is a group of software professionals employed by a vendor and assigned to work only on your product, for as long as the engagement runs. You set priorities and accept the work. The vendor handles hiring, payroll, equipment, benefits and replacing anyone who leaves.

The word doing the work in that definition is only. Engineers on a dedicated pod are not shared across three other accounts, so context accumulates instead of resetting. That accumulation is the whole economic argument for the model.

By the time a founder or a VP of Engineering reaches me, they have usually already decided that hiring in-house will take too long. The US median wage for a software developer sits at $133,080 as of May 2024, according to the Bureau of Labor Statistics, before benefits, recruiting and equipment. The salary is rarely what stops them. The four months of empty desk is.

Three models sit next to each other and get confused constantly. Staff augmentation gives you individual engineers who work under your management, while a fixed-price project hands the vendor a defined scope and a deadline. A dedicated team sits between them: a standing cross-functional group with a vendor-side lead, running your backlog on a monthly retainer. I have written a fuller breakdown of how the three engagement models compare, including what each one does to your contract, so I will keep this piece on the dedicated model itself.

The global IT services outsourcing market was valued at $744.6 billion in 2024 and is projected to reach $1.22 trillion by 2030, per Grand View Research. Deloitte’s Global Outsourcing Survey finds around 80% of executives plan to hold or increase that investment. What has shifted is the reason. Access to senior talent now sits alongside cost as a primary driver, and that shift is what pushed the dedicated model from a budget decision to a capacity decision.

 Dedicated Development Team Structure: Who Is on the Team and What Each Role Owns

Team composition is the part buyers get quoted on and the part they understand least. A quote for “five developers” and a quote for “a five-person pod” describe different things and different monthly numbers.

The useful way to read a proposed structure is by output. For every role on the list, ask what you should be able to see from that person every single week. If the answer is vague, the role is padding.

Role What They Own What You Should See Every Week Core or Optional
Delivery lead / project manager Sprint planning, blockers, reporting, the relationship A written status with committed vs delivered, risks named Core
Product owner Priorities, trade-offs, acceptance This is usually your person, not theirs Core, usually client-side
Software engineers (backend, frontend, full-stack) Building and maintaining the product Merged pull requests against agreed tickets Core
QA engineer Test plans, regression, release readiness Bug reports with reproduction steps, a green release check Core
Business analyst Turning business rules into acceptance criteria Written specs that developers do not have to interpret Optional below five people
Software architect Stack decisions, scalability, technical direction Decision records, reviewed at milestones rather than weekly Optional, often part-time
DevOps engineer CI/CD pipeline (the automation that builds, tests and deploys code), environments, monitoring Deployment frequency, uptime, alerting that works Optional until multi-environment
UX/UI designer Flows, screens, design system Handoffs a developer can build from without asking Optional, often part-time

People sometimes ask what a development team’s role is in general terms. In this model it is narrow and worth stating plainly: the team owns how the product gets built, and you own what gets built and why.

Below five people, a pod cannot carry a full-time business analyst, architect and DevOps engineer. Those responsibilities get absorbed by senior engineers and the delivery lead, which is fine at that size. Above eight, splitting them out stops being a luxury.

The cheapest quote in your inbox is usually the one that stripped out the delivery lead and the QA engineer. Those two roles are what make a pod self-managing, and removing them moves their work onto your calendar without moving it off your budget. When you compare proposals, normalize them to the same composition first, then compare the monthly totals.

When a Dedicated Development Team Is the Right Model, and When It Is Not

The model fits three situations well. Your roadmap is genuinely evolving and you cannot write a scope document that will survive the quarter. Your engagement runs past six months, so there is time to recover the ramp. Or your product needs several skills at once, backend, mobile, QA, DevOps,  and hiring all of them takes longer than the market will wait.

It also fits the recovery case, where an internal team is stretched thin or a previous build stalled. A standing pod can absorb an existing codebase in a way that rotating contractors cannot, because someone stays long enough to learn why the code looks the way it does.

Three situations make it the wrong purchase. A locked scope with a fixed deadline is better served by a fixed-price contract, and that includes most MVP builds with a defined end date.

A single skill gap is better served by staff augmentation, where you add one or two engineers to a team you already run. And a short engagement, under about four months, spends too much of its life in the ramp. You pay for a team that is still learning your domain when the contract ends.

There is a fourth case worth naming, and it is the one people resist hearing. If nobody owns priorities, the model will underperform no matter how strong the engineers are. I cover the test for that further down, and if it comes back negative you are better off keeping the build in-house until the product ownership exists.

Dedicated Development Team Cost: Monthly Retainer by Pod Composition

Most cost guidance for this model is published as an hourly rate for one engineer, which is a difficult number to plan against. What a CFO needs is a monthly figure attached to a specific group of people, and an honest statement of what that group can produce.

The table below composes three pods at offshore delivery rates and gives the monthly retainer for each. The arithmetic is straightforward: role hours multiplied by regional rate, at roughly 160 billable hours per person per month.

Pod Composition Monthly Retainer (Offshore Delivery) What It Realistically Ships in a Quarter
Starter Pod (3 people)
1 senior engineer, 1 mid engineer, 1 QA engineer, delivery lead at 25%
$11,000 – $19,000 A focused feature stream on an existing product, or a narrow v1 with a small surface area
Product Pod (5 people)
Delivery lead, 2 senior engineers, 1 mid engineer, 1 QA engineer, designer at 50%
$18,000 – $32,000 A working product from scratch, or two parallel feature streams with releases every sprint
Scale Pod (8+ people)
Delivery lead, business analyst, 4 engineers, QA engineer, DevOps at 50%, designer at 50%
$29,000 – $52,000 Multi-platform delivery, integration-heavy work, or a modernization running alongside live operations

Four things move these numbers more than anything else. Seniority mix comes first, because a pod of leads costs close to double a pod with a healthy junior-to-senior spread and does not ship twice as much. Region comes second: offshore and nearshore delivery generally lands 40 to 70 percent below a US in-house baseline.

Specialist skills come third. Machine learning, security and heavy integration work all price above general application development, and adding one specialist can move a pod between the bands above.

Contract length comes fourth. A three-month commitment prices higher per month than a twelve-month one, for the same reason a month-to-month lease costs more than an annual one.

Not ready to talk about a team yet?

Answer a few questions about your scope and get an indicative build cost before you decide how to staff it.

Estimate your cost first

The 90-Day Ramp: What Weeks 1 to 12 Actually Deliver

Vendors compete on how fast they can staff a team, and staffing is genuinely quick. It takes days rather than the two months an internal hire takes. Staffing speed is a poor proxy for output, though, and confusing the two is how boards end up with dates nobody can hit.

The number to plan against is time to predictable velocity, meaning the point where what the team commits to in sprint planning is close to what lands in production. Here is what that period looks like when it goes well.

Weeks What the Team Is Doing What You Have to Supply The Signal It Is on Track
1–2 Contracts, accounts, environment setup, architecture walkthrough, reading the codebase Repository and staging access on day one, a named point of contact, one hour of honest architecture context The team has the application running locally and has opened its first pull request by the end of week two
3–4 First merged work on small, well-scoped tickets Two sprints of groomed backlog, same-day answers to blocking questions Something the team wrote is in production, and their questions get noticeably more specific
5–8 Taking whole features, producing their own estimates, finding the sharp edges Acceptance criteria in writing, decisions returned inside 48 hours Estimates start matching actuals, and the defect rate on their work falls sprint over sprint
9–12 Steady delivery, proposing approaches rather than waiting for direction Priorities. Little else Committed versus delivered lands within about 10% for two consecutive sprints

Week one is where most of the damage gets done, and almost always on the client side. A team that spends its first four days waiting for repository access has lost a third of its first sprint before writing anything.

The other week-one failure is treating onboarding as a list of tool credentials. Walk the team through why the architecture looks the way it does, including the decisions you regret. Teams that understand the reasoning behind existing technical debt integrate faster than teams handed a ticket queue.

A LESSON FROM A RECOVERY ENGAGEMENT: We took over Lulo Freight’s freight-management platform after a previous development partner could not complete it to the agreed scope. The ramp on a takeover looks different from a greenfield build: the first three weeks go into reading and mapping someone else’s code rather than writing new features, and any plan that skips that stage pays for it in month three. If you are inheriting a codebase, budget the audit explicitly instead of hoping the team absorbs it while shipping.

The Backlog Capacity Test: Can You Keep a Dedicated Team Fed?

Here is the pattern I see most often in engagements that go badly. The engineering was fine. The team ran out of decided work, filled the gap with low-value tickets, and by month four the client was paying full retainer for a team that had quietly become a maintenance crew.

McKinsey and the University of Oxford studied large IT projects and found they ran 45 percent over budget and delivered 56 percent less value than predicted. Governance and scoping drove those overruns rather than the technology. A dedicated team concentrates that risk, because you are committing to a fixed monthly cost regardless of whether the work is ready.

So before you evaluate a single vendor, score yourself. Six questions, three points maximum each.

# Question 0 points 1 point 2 points 3 points
1 Sprints of groomed, ready-to-build work you have right now None Less than one One to two More than two
2 Who owns the backlog day to day Nobody yet A founder part-time A product manager part-time A full-time product owner
3 How fast a blocking decision comes back Unpredictable About a week Two to three days Within a day
4 Expected length of the work Under 3 months 3 to 6 months 6 to 12 months Over 12 months
5 Development environment readiness Not sure Not ready Partly ready Repo, CI and staging all ready
6 Scope stability Genuinely open Evolving each quarter Mostly locked Fully locked

13–18: a dedicated team fits. Size the pod to your backlog depth rather than your ambition, and start one person smaller than you think you need.

7–12: start smaller. A three-person starter pod will expose your real capacity to feed it inside two sprints, at a third of the commitment. Close the lowest-scoring gap first, and it is almost always question 2.

0–6: a dedicated team is the wrong purchase right now. Question 6 scoring high alongside a low total means you want a fixed-price build. A low score driven by questions 1 and 2 means you want staff augmentation, or an internal product owner before you want anything external at all. Spending a retainer to discover this in month four is expensive, and the in-house versus outsourcing comparison is the better place to start.

THE CONTESTED PART: Most dedicated-team failures are demand-side. The vendor is rarely the reason the model underperforms; an unfed backlog is. Any partner willing to tell you before signature that your score is too low is worth more than one who quotes you a pod the same afternoon.

A Dedicated Development Team in Practice: Running a Dedicated Frontend Pod for Traver Connect

Traver Connect came to us with a shape that suits this model exactly. They had their own backend team and their own product direction. What they lacked was frontend capacity to keep pace, and hiring for it would have taken longer than their roadmap allowed.

We acted as their dedicated frontend team. Our engineers owned the user-facing side of a SaaS agent-support platform, including an agent storage system for managing calling and support operations, while their team held the backend. Two teams, one product, with the split running along a clean system boundary rather than a shared ticket queue.

That boundary is the part I would ask any reader to copy. When both teams pull from one undifferentiated backlog, code review and merge conflicts turn into a daily negotiation and velocity quietly drains away. Splitting by layer or service gives each side something it owns end to end.

The technically interesting part was Tylnx, the calling service the platform depends on. We researched it, integrated it, and then helped design the architecture around it so it would hold up as call volumes grew. That work sat outside the original frontend brief, and it happened because the same engineers had been on the product long enough to see the constraint coming.

That is the return on continuity. A rotating set of contractors would have built the screens and stopped there.

We run the same structure across other engagements. For Al Rostamani Group we ran parallel workstreams across six divisional websites with one team holding the standards, which is the same continuity argument applied to breadth rather than depth. You can see how these engagements are structured across projects we have run end to end.

How to Manage a Dedicated Development Team without Managing It Daily

The promise of this model is that the vendor’s delivery lead absorbs day-to-day management. That works when the cadence is agreed in week one and written down. It stops working when “we’ll sync as needed” is the plan.

Here is the rhythm I recommend, and the honest cost of it in your time.

Ceremony Frequency Who Attends From Your Side What You Get What It Costs You
Standup Daily, 15 minutes Optional; product owner twice a week Blockers surface same-day ~1 hour a week
Backlog grooming Weekly, 60 minutes Product owner Next sprint is buildable ~1 hour a week
Sprint planning Every 2 weeks Product owner Commitment you can hold them to ~1 hour a fortnight
Sprint demo Every 2 weeks Product owner, stakeholders Working software, not a status slide ~1 hour a fortnight
Monthly steering Monthly Whoever owns the budget Velocity trend, risks, team changes ~1 hour a month

Two mechanisms matter more than the meetings. The first is decision latency, meaning how long a blocking question waits for your answer. Inside 24 hours and the team keeps moving; past a week and the sprint is already compromised.

The second is the escalation path. Agree in writing who gets called when something is wrong, on both sides, and what the response window is. Escalation defined in advance is a process, and escalation invented during a crisis is an argument.

For continuous delivery, meaning a dedicated team running without a defined end date and shipping every sprint, add one more thing: a quarterly review of composition against the roadmap. Teams that were right in January are often the wrong shape by July, and nobody notices until the retainer starts feeling expensive. Our own custom software engagements build that review into the cadence for exactly that reason.

Vetting a Dedicated Development Team Vendor: Five Team-Level Questions

General vendor due diligence covers references, security posture, pricing clarity and contract terms. That applies here as it does to any engagement, and I have set out the full pre-contract scorecard elsewhere. These five questions are specific to buying a team rather than a project.

  1. Can I see anonymized CVs and interview the people, before signature? A vendor confident in their bench will send CVs early and put you in front of the delivery lead and the senior engineer. Resistance here, or an offer to introduce the team after signing, tells you the pod will be assembled from whoever is free that month.
  2. What is your attrition rate, and who is the key-person commitment? Every departure costs you a ramp you already paid for. Ask for the number, and ask which specific person is contractually committed to stay on the account.
  3. What is the replacement SLA in writing? How many days to a replacement, who pays for the overlap, and does the outgoing engineer stay for a handover. A reasonable standard is a replacement inside two weeks with a vendor-funded overlap. Without a written term, this becomes your budget problem.
  4. What are the team’s working hours in my time zone? Ask for the team’s hours, not the vendor’s office hours. Four hours of overlap covers standup, questions and the demo. Below two hours, every clarification becomes a next-day event and velocity drops even though nobody worked less.
  5. Walk me through your last client onboarding, week by week. A vendor who has done this well can describe week one in specifics. A vendor who answers in adjectives has not thought about the ramp, which means you will be paying for it.

Vetting an individual specialist works differently, because the criteria narrow to stack depth and portfolio, as I set out in the guide to hiring for a single platform.

Scaling Down and Ending a Dedicated Team Engagement

Every engagement ends. Deciding how before you start is what makes the ending cheap.

Scaling down is the common case. Agree a notice period per role, where 30 days is standard and negotiable, and agree it separately from the overall contract term. Without that, reducing a pod from eight people to five turns into a contract renegotiation at the exact moment your budget is under pressure.

Ending properly is a handover rather than an event. You need the repository under your control from day one, documentation that survives the team, credentials transferred, and a defined overlap where the outgoing team answers questions for whoever picks the work up.

Two contract terms carry most of the weight here. IP assignment gives you full ownership of source code, designs and documentation, transferring on payment. A transition clause commits the vendor to a specific handover rather than goodwill. Both belong in the statement of work before kickoff, and I have set out the six clauses that decide who owns the code in more detail.

One practical note on pausing. Engineers who are not billing get reassigned, so a three-month pause usually means a different team comes back and the context you paid to build goes with the old one. If your work is seasonal, negotiate a reduced-capacity floor instead: keep one or two people on and scale back up.

Conclusion

The decision in front of you is whether you have a roadmap that needs a standing team and the product ownership to keep that team busy. If you do, a dedicated pod buys you continuity that contractors cannot and speed that hiring cannot. The monthly number is also easier to defend to a board than three open requisitions that have sat unfilled since spring.

If you do not, meaning the scope is locked, or the backlog is thin, or nobody owns priorities yet, a dedicated team will cost you more than it returns. A fixed-price build or a couple of augmented engineers will serve you better, and there is no shame in the smaller commitment.

Score yourself on the six questions above before you take a call with anybody, including us. It takes two minutes and it will change what you ask for.

Get a dedicated team composed and costed for your roadmap

Send us your roadmap and your current team. We will come back with a pod composition, a monthly figure and a start date.


Talk to our engineering team

AR in Construction: What It Costs, Which Hardware Survived, and What to Build vs. Buy

Augmented reality in construction puts the Building Information Model (BIM) onto the physical site, viewed through a tablet, a phone or a headset, so a crew sees the ductwork exactly where the ductwork is going. The abbreviation is overloaded on a jobsite, so to be clear: this article means augmented reality, not an Action Request or an Architect’s Response.

One fact should frame the rest. Microsoft stopped producing HoloLens 2 in October 2024, exited AR headset hardware altogether in February 2025, and set support to end on 31 December 2027. That device anchored the category for years, and plenty of published guidance still recommends it for new deployments.

The technology itself works. What has changed is which hardware you can safely specify, what a deployment costs once model preparation is counted, and whether you should license a platform instead of building one.

TL;DR: AR in Construction

Pick the use case → pick the accuracy tier → pick the device → licence or build → pilot on one crew

  1. Decide what job AR is doing: Design review, progress capture, remote assistance, and setting-out are four different problems, so define the use case before choosing a device.
  2. Match the accuracy tier to the job: Millimetre-level work needs engineering-grade hardware, while many other construction workflows can run on a tablet.
  3. Check hardware support: Make sure the device is still supported before investing, as the category’s best-known headset is already end-of-life.
  4. Budget for model preparation: Preparing models for AR is the single most-reported obstacle, ranking ahead of cost.
  5. Licence standard workflows, build specific ones: Off-the-shelf solutions are suitable for standard workflows, while specialised requirements may justify custom development.
  6. Pilot before scaling: Test the solution with one crew, one site, and one measurable outcome before committing to a wider deployment.

What Does AR Mean in Construction?

Augmented reality places computer-generated content into your view of the real world. On a construction site that content is almost always the BIM model — the 3D design plus the data attached to it, anchored to the physical location where the work is happening.

You look through a tablet, a phone or a head-mounted display, and the ductwork appears where the ductwork is meant to go. The model moves with you as you walk.

Three related terms get used interchangeably and mean different things. Virtual reality replaces your view entirely. Mixed reality lets digital objects interact with the physical space around you. Extended reality (XR) is the umbrella covering all three.

The taxonomy of AR itself, marker-based, markerless, location-based, projection, matters more when you are specifying a build than when you are choosing a use case. I have covered that separately in our guide to how AR applications are built.

Scoping an AR pilot and not sure where it lands?

Get your use case mapped to a device tier, a build approach and a cost band before you commit budget.

Talk to a solutions architect

AR vs VR vs Mixed Reality on a Construction Site

Technology What It Does Construction Application Typical Device
Augmented Reality (AR) Adds digital content to your view of the real world On-site BIM overlay, clash checking, progress capture, guided install Tablet, phone, AR headset
Virtual Reality (VR) Replaces your view with a fully digital environment Design review before ground is broken, hazard and safety training Enclosed headset, office-based
Mixed Reality (MR) Digital objects anchor to and interact with the physical space Trade coordination, setting out, MEP walkthroughs Head-mounted display

The practical difference for a contractor is where each one is used. VR lives in the office and the training room. AR and MR go to the site, which is why they carry the hardware and connectivity constraints covered further down.

How AR Is Used in Construction: Seven Applications That Are Actually Deployed

Design visualization and constructability review

Teams walk a model at full scale on the site itself and catch problems that read fine in 2D. This is the most common use by a wide margin, 77% of surveyed AEC professionals named design visualization and evaluation as their primary AR/VR application.

Clash detection in the field

Office-based clash detection finds model-to-model conflicts. On-site AR finds model-to-reality conflicts, which is a different and often more expensive category of problem, the duct that clashes with a beam that was poured 40 mm out.

Progress capture

Some platforms use the device’s AR positioning to recognise where you are in the floorplan and photograph from the same point every visit. Consistent capture points make progress genuinely comparable week to week.

Remote assistance

A specialist in the office sees the crew’s camera feed and annotates directly onto it. The annotation stays anchored to the object even when the camera moves.

Setting out and layout

Engineering-grade systems project the model onto the slab so crews can position elements without a surveyor on standby for every step. This tier is covered in more detail below.

Safety training and hazard recognition

Research on VR-based safety training for construction trades reported hazard recognition improving by 39% and hazard management performance by 44%. Training mostly runs in VR rather than AR, and it is one of the strongest evidenced applications in the field.

The more interesting safety work is moving in a different direction. Dr. Omidreza Shoghli and colleagues at the William States Lee College of Engineering, University of North Carolina at Charlotte, have been building AR systems that predict vehicle intrusions into highway work zones and warn the worker through the headset in real time. That points at where AR may earn its keep first — not showing people a model, but telling them something they cannot see coming.

Client presentations and bid support

Showing an owner the finished building standing on the site changes the conversation. Architecture firms and owners are consistently ranked as the parties benefiting most from these technologies, ahead of contractors.

How AR Connects to BIM, Revit and Autodesk Forma

This is where most of the work actually sits, and it is the part that surprises people.

A Revit model carries far more geometry and metadata than a handheld device can render at a usable frame rate. Loading it raw onto a tablet produces something slow enough that crews stop using it by the second week.

The normal path is an export to IFC — the open file format the industry uses to move models between tools, or to a platform-specific format, followed by an optimization pass that strips detail nobody needs on site. Fastener geometry and manufacturer metadata can go. Structural grid, MEP runs and setting-out points stay.

That preparation step is the most-reported obstacle in the field. Dr. Vahid Balali, Professor of Civil Engineering and Construction Engineering Management at California State University, Long Beach, has tracked AR and VR adoption across the industry since 2018. In his team’s most recent round, 61% of surveyed practitioners named the time-consuming model translation and optimization process as their top AR/VR challenge, up from 45% three years earlier. Interoperability between tools rose over the same period, from 21% to 32%.

Budget for it. A pilot that allocates nothing to model preparation is a pilot that stalls before the first site walk.

If your models sit behind a common data environment or an ERP that also holds cost and schedule data, the pipeline needs to be built once and maintained. That work is closer to connecting model data to existing systems than to app development.

The number that should shape your budget: Across three survey rounds of North American AEC professionals, model translation and optimisation overtook every other reported obstacle, including cost. Sixty-one percent named it in 2023. If your plan has a line for hardware and no line for getting models onto that hardware, the plan is incomplete.

AR Hardware for Construction in 2026: What Survived

The hardware market reset and a lot of guidance has not been updated to reflect it.

Microsoft ended production of HoloLens 2 in October 2024, confirmed in February 2025 that it was exiting HoloLens hardware development entirely, and set support to end on 31 December 2027. No successor has been announced. Devices already deployed keep working and keep receiving security updates until that date.

That matters because HoloLens anchored the enterprise AR category for years and sits underneath other products. If a vendor recommends it for a fresh rollout in 2026, they are working from an old script.

Device Status (Sept 2026) Accuracy Tier Indicative Hardware Cost Recommendation
Microsoft HoloLens 2 Production ended Oct 2024; support ends 31 Dec 2027; no successor Centimetre ~$3,500 at launch Do not specify for new deployments
Trimble XR10 Built on HoloLens 2 — inherits the same end date Centimetre Enterprise quote Existing fleets only; plan a transition
Magic Leap 2 Active, enterprise-focused Centimetre Enterprise quote Viable; confirm it can be worn with site PPE
Apple Vision Pro Active Centimetre ~$3,500 Office and design review; not a site device
Meta Quest (passthrough) Active Visual only Consumer pricing Training and design review, not field accuracy
XYZ Reality HoloSite Active; purpose-built for construction 3–5 mm Enterprise quote The option when setting-out accuracy is the requirement
Tablet / phone (ARKit, ARCore) Active Visual to centimetre, drifts Hardware you already own Where most firms should start

Two things to take from that table. First, the accuracy column separates the market more meaningfully than price does. Second, the bottom row is where the majority of firms should begin, because it costs nothing in hardware and tests whether the workflow holds before anyone buys a headset.

One more constraint that rarely appears in vendor material: site PPE. A practitioner interviewed for the Cal State Long Beach study described headsets running hot enough to be unpleasant over a shift, and noted that some devices simply cannot be worn with a hard hat on. Confirm PPE compatibility before you buy anything, not after.

Specifying hardware for a live site?

We will map your use case to an accuracy tier and tell you where a tablet is enough.


Get a device-tier assessment 

AR in Construction Cost Breakdown by Build Tier

Hardware is the visible cost and usually the smaller one. The spend that decides whether a deployment works sits in model preparation, integration and the pipeline that keeps models current.

Build Tier What It Includes Indicative Range Typical Timeline
Licensed Platform Pilot Off-the-shelf AR platform, one use case, existing devices, model prep for one project $5,000 – $20,000 2 – 6 weeks
Custom AR App, Single Workflow Purpose-built app, BIM ingestion pipeline, one integration, iOS or Android $30,000 – $80,000 3 – 6 months
Production Build with Model Pipeline Multi-platform app, automated model optimization, CDE and ERP integration, offline sync, device management $100,000 – $250,000 6 – 12 months
Engineering-Grade Deployment Survey-accurate hardware, control-point workflow, trained operators, QA process $150,000 – $400,000+ 6 – 12+ months

The costs buyers routinely miss are the recurring ones. Model preparation repeats every time the design changes. Someone has to own device provisioning and app updates. Platform licenses are usually per-seat per-month and scale with crew size rather than project value.

One trend is worth weighing against that spend. Between 2018 and 2023, change orders and cost management climbed from near the bottom of the list of emerging AR/VR applications to third place among surveyed professionals. Firms are starting to aim this technology at commercial disputes rather than design presentation, which is a more durable place for it to sit and a much easier one to build a business case around.

For a rough sense of what a comparable custom build involves before you scope AR specifically, our indicative cost calculator covers the standard variables, and typical build timelines sets expectations on duration.

Buy a Platform or Build Custom? The Four-Question AR Decision Test

I use four questions with clients scoping this. Three or more “standard” answers means licence. Two or more “specific” means build.

Licence or Build? Use These 4 Questions

1. Is the workflow standard or specific to your business?

Standard
Progress capture, remote assistance, design review
→ LICENCE
Specific
Your own approval chain, pricing logic, ordering path
→ BUILD

2. Does the data need to move both ways?

One way
View the model on site
→ LICENCE
Two way
Field data updates the model, ERP, or order system
→ BUILD

3. Who owns the captured site data?

Platform terms are acceptable
You are comfortable with the platform’s data terms
→ LICENCE
Full ownership required
You need full ownership and export at handover
→ BUILD

4. How many field users in year one?

Under ~25 users
Single use case
→ LICENCE
Larger fleet
Several workflows or multi-year deployment
→ BUILD

Licensing is the right answer more often than people expect. A mature platform has already solved model optimisation, device management and offline behaviour, and those are the parts that take longest to get right.

The same Cal State Long Beach research picked up a related shift: firms are increasingly choosing to outsource AR/VR work rather than build the capability in-house, and leaning on lower-cost virtual design and construction tooling to reduce how much internal AR expertise they need at all. That matches the staffing numbers, the share of firms with no AR/VR specialists doubled over the same period. Very few contractors want a permanent AR team.

Building earns its cost when the workflow is the differentiator. If AR is feeding an ordering pipeline, a proprietary approval chain or a data model nobody sells off the shelf, a platform will fight you. That is the point at which commissioning a custom build becomes the cheaper option over a three-year horizon.

What a Real AR Build Looks Like: Spatial Scanning and Render Accuracy

We built CPTNS, an AR and AI-driven design platform in the construction space, and the engineering problem in it is the same one a site-based AR tool faces.

Users scan their surroundings on a phone, the app stitches multiple images into a continuous view of the space, and an AI coping plotter positions material selections onto that geometry using geometric algorithms. The output has to be accurate enough that someone will place an order against it.

Three decisions carried that build. The scan-and-stitch step had to tolerate real-world lighting rather than studio conditions. Rendering ran natively on iOS and Android, because cross-platform rendering could not hold the frame rate the interaction needed. The platform maintained 99.95% uptime through peak load.

The transferable lesson is that the AR layer is the visible part and the smaller engineering problem. Capture quality, geometry handling and render performance are what determine whether the tool survives contact with real users.

Why AR Pilots Fail on Real Sites

The honest position on this technology is that adoption has gone backwards, and that is worth understanding before you commit.

Balali’s surveys, run through the Construction Management Association of America, reached more than 200 AEC professionals across 2018, 2020 and 2023. The trend line is not the one the category’s marketing implies.

AR/VR use among respondents rose from 56% to 65%, then fell to 44% in 2023. The share of firms with no AR/VR specialists on staff went from 14% to 29%. The proportion of respondents with under a year of experience with the technology reached 42%, which points to churn rather than growth.

His team concluded that early optimism gave way to tempered expectations as costs, limitations and implementation difficulty became clear. That is the context a demo will not give you.

Here is what actually breaks, and what to do about each.

  1. Model preparation is under-budgeted. Named by 61% of surveyed practitioners as the top obstacle. Mitigation: scope the optimisation pipeline as a deliverable with an owner, not as a setup task.
  2. Site conditions defeat the device. Jobsite usability problems including poor lighting were the second most-cited limitation at 43%. Dust, glare and glove operation all degrade touch interfaces. Mitigation: run the pilot in the worst conditions on the project, not the best.
  3. Connectivity is assumed. Many platforms expect a live connection for collaboration and sync. Mitigation: require genuine offline working and a reliable sync-on-reconnect path in the evaluation, and test it with the radio off.
  4. The accuracy tier is wrong for the job. A tablet gives a visual impression; it will not hold position well enough for setting out. Engineering-grade systems reach 3–5 mm and cost accordingly. Mitigation: decide the tier from the task, then let it set the budget.
  5. PPE compatibility is checked last. A headset that cannot be worn with a hard hat is not a site device. Mitigation: put PPE compatibility in the procurement criteria.
  6. Nobody defined the problem first. Dr. Steven K. Ayer, Associate Professor of Construction Engineering at Arizona State University, came to AR by hunting for problems the technology could solve, and he puts the awkward question directly: what happens when a technology gets implemented without a problem to solve? Pilots launched because the technology looked impressive end when the champion moves on. Mitigation: one metric, agreed before the pilot starts, RFIs avoided, rework caught, site visits eliminated.
My position on the gimmick question: AR in construction works, and it works in a narrower band than the marketing suggests. The firms getting value from it picked one workflow, matched the accuracy tier honestly, and budgeted for model preparation. The firms that bought headsets first are the reason adoption numbers went down.

How to Run a First AR Pilot Without Wasting the Budget

Keep it small enough that failure is cheap and specific enough that success is legible.

Pick one use case and one crew. Choose the accuracy tier from the task rather than the budget. Use devices you already own unless the task genuinely requires survey accuracy.

Scope model preparation as its own deliverable with a named owner and a real allocation. Run the pilot on the hardest site conditions you have, not the easiest. Agree one success metric before anyone starts.

Then give it a full project phase. Two site walks will tell you whether the technology works; only a phase will tell you whether the crew keeps using it.

Conclusion: Match the Tier, Budget the Pipeline, Pilot Small

AR in construction has moved past the demo stage, and it delivers inside a narrower band than the category’s marketing implies. The technology is capable. The failures are almost entirely about specification.

Choose the accuracy tier from the work rather than the brochure. Budget for getting models onto devices, because that is what practitioners report as their biggest obstacle. Check the hardware still has a support runway, since the best-known device in this category does not.

Then start with one crew and one measurable outcome. A contractor who runs a disciplined pilot on a tablet will learn more in one project phase than a firm that buys twenty headsets and hopes.

Scope your AR pilot before you buy the hardware

Our engineers will map your use case to a device tier, a build approach and a cost band, so the pilot is specified around your site conditions rather than a vendor demo.

Get a scoped AR pilot estimate 

Not sure which tier your use case needs? Run through it with a solutions architect. Five questions, one call.

Flutter App Development Cost in 2026: What You Pay and Why Quotes Vary

Flutter app development cost sits between $20,000 and $150,000 for most business apps, with the majority of funded builds landing between $30,000 and $80,000. That range is wide because the market genuinely is wide, and because the word “app” can honestly describe four different projects.

The question is almost never “what does Flutter cost.” It is closer to this: “I have two quotes, one is $38,000 and one is $115,000, and I cannot tell which one is lying to me.”

Usually neither of them is. They are pricing different projects that happen to share a name.

This piece breaks Flutter pricing into the numbers I actually quote to the clients looking for flutter app development services, explains what moves a build from one tier to the next, and gives you a way to read an estimate so that gap stops being a mystery.

Key Takeaways

  • Most Flutter builds cost $30,000 to $80,000: A scoped MVP can start near $20,000, while enterprise platforms can exceed $150,000.
  • Flutter can reduce development costs: A shared Flutter codebase can save 30% to 40% compared with separate native iOS and Android builds, with further savings in post-launch maintenance.
  • Four factors drive most cost differences: Scope clarity, custom design requirements, team location, and the amount of backend infrastructure already available can create a major difference in quotes.
  • Plan for ongoing costs: Budget around 20% to 30% of the initial build cost each year for maintenance, hosting, and third-party services.
  • Compare itemised quotes: A quote that excludes QA, backend development, or post-launch support is not necessarily cheaper—it may simply be incomplete.

What Flutter App Development Costs in 2026

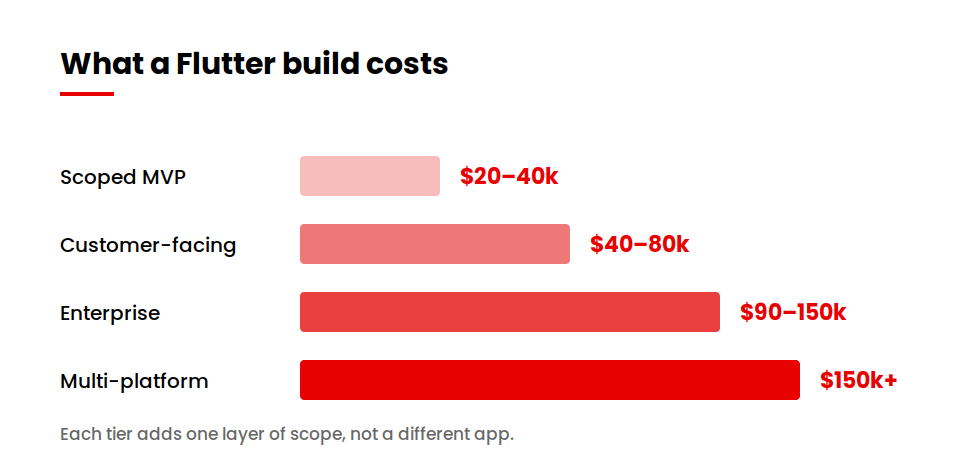
Flutter app development costs $20,000 to $150,000 for most commercial projects in 2026. A single-purpose internal tool or a scoped MVP starts around $20,000. A customer-facing app with accounts, payments and notifications typically runs $40,000 to $80,000. Enterprise platforms with role-based access, compliance requirements and legacy integrations begin at $90,000 and climb from there.

Here is how that breaks down by build tier.

Build Tier Cost Range Timeline What You Get
Scoped MVP or Internal Tool $20,000 – $40,000 2 – 3 months Core workflow, standard components, single platform focus, minimal custom design
Customer-Facing App $40,000 – $80,000 3 – 5 months Custom design, user accounts, payments, notifications, analytics
Complex or Enterprise App $90,000 – $150,000 5 – 9 months Role-based access, admin dashboards, third-party integrations, compliance work
Multi-Platform Platform $150,000+ 8 – 12+ months Mobile plus web or desktop, real-time features, scalable backend architecture

Flutter app development cost tiers from scoped MVP through multi-platform build

One number worth holding onto: the median Flutter project we scope comes in near $55,000. Most of the quotes that shock people are either well below that because something has been left out, or well above it because the scope quietly includes a backend rebuild.

Flutter App Development Cost by App Type and Business Stage

The tier table above is a starting point. Two other lenses usually get a founder closer to their real number.

Cost by what you are building

App Type Cost Range Main Cost Driver
Internal Business Tool $20,000 – $45,000 Number of user roles and reporting depth
Marketplace or Booking App $45,000 – $95,000 Two-sided flows, payments, scheduling logic
eCommerce App $50,000 – $110,000 Catalogue size, payment methods, order management
Field Service or Logistics App $55,000 – $120,000 Offline handling, GPS, sync conflict resolution
Healthcare or Fintech App $80,000 – $180,000 Compliance, audit logging, encryption standards

Offline handling is the one people underestimate most. An app that works when the signal drops needs conflict resolution, a local data store and a sync strategy, and that combination adds real weeks. We built a field service app where offline sync was the single largest line item in the estimate, ahead of the interface work.

Flutter app development cost by where your company is

Stage Typical Budget What the Money Buys
Pre-Seed or Bootstrapped $20,000 – $40,000 Validation. One workflow, done properly.
Funded Startup $40,000 – $100,000 A product that can carry growth without a rewrite
Established SMB $60,000 – $140,000 Integration with systems you already run
Enterprise $120,000+ Security review, procurement, multi-stakeholder sign-off

Enterprise budgets look inflated next to startup ones for the same feature list. Much of that difference is not engineering. It is security review cycles, procurement, and the cost of getting five stakeholders to agree on a scope.

If your answer to the budget question is “smaller than any of these,” start with MVP development and validate before you spend the rest.

What Actually Drives Flutter App Development Cost

Five things move the number, in roughly this order of impact.

Features and how complex each one is

Feature pricing is the part most estimates itemise, so it is the easiest to compare between vendors.

Feature Typical Cost to Build
Email and Password Login $2,000 – $3,000
Social Login (Google, Apple) +$1,500
Biometric or Multi-Factor Authentication $2,000 – $5,000
Push Notifications $2,000 – $3,500
Real-Time Chat $8,000 – $15,000
Single Payment Gateway $3,000 – $5,000
Subscription Billing +$4,000 – $6,000
Offline Mode with Sync $8,000 – $18,000
AI or Recommendation Features $10,000 – $40,000
Each Third-Party Integration $1,000 – $5,000

Real-time chat is the classic budget surprise. It reads like one line on a feature list and prices like four, because presence, delivery receipts, message history and push handling are separate pieces of work.

How much custom design you want

Flutter ships with two complete design systems built in. Material Design covers the Android look, and Cupertino covers the iOS one. Using them costs almost nothing extra.

Design Approach Added Cost
Flutter Defaults, Light Theming $0 – $3,000
Branded Design System $8,000 – $18,000
Fully Custom UI with Animation $18,000 – $35,000

Custom design is the most commonly over-bought line item in a first build. If you are validating an idea, the default components will not lose you a single user.

Which platforms you target

Flutter runs from one codebase, and that codebase can reach more than phones. Each additional target adds real work.

  • Web support: +20 to 30 percent of the mobile cost
  • Each desktop platform (Windows, macOS, Linux): $8,000 to $15,000
  • Foldable device support: $5,000 to $10,000
  • Optimised tablet layouts: +15 to 25 percent

Compliance, if it applies to you

HIPAA (the US health data rule), GDPR (the European privacy regulation) and PCI-DSS (the payment card standard) each add $10,000 to $40,000 depending on how much of your app touches regulated data. That covers audit logging, encryption standards, access controls and the documentation your auditor will ask for.

How much backend already exists

This is the driver almost nobody asks about before requesting a quote, and it moves the number more than anything except scope itself.

The freelancers quoting day rates on r/FlutterDev see the same pattern from the other side of the table. “Is a backend needed? Huge factor because it is its own independent software project,” one put it in a thread on pricing Flutter work, a line worth holding onto before you compare two quotes.

If you have a working API, a Flutter app is a front end. If you have a database but no API, someone has to build the layer in between. If you have neither, you are paying for a complete backend alongside the app, and that can be 40 percent of the total.

Flutter Developer Rates by Region and Team Structure

Where your team sits changes the same project’s price by a factor of four.

Region Mid-Level Senior Lead / Architect
US and Canada $100 – $150/hr $150 – $200/hr $200 – $250/hr
Western Europe $80 – $120/hr $120 – $160/hr $160 – $200/hr
Eastern Europe $50 – $80/hr $80 – $120/hr $120 – $150/hr
South Asia and Southeast Asia $30 – $50/hr $50 – $80/hr $80 – $120/hr

Rate is not the same as cost. An experienced team at $110 an hour that ships in fourteen weeks costs less than a cheaper team at $55 an hour that takes thirty-two weeks and needs two rounds of rework. The rework never appears in the original quote, which is why the cheaper bid keeps winning.

A working Flutter team usually looks like this:

  • One to three Flutter developers, carrying 60 to 80 percent of the hours
  • One designer, active for 20 to 30 percent of the timeline
  • One backend developer, 30 to 50 percent depending on what exists already
  • One QA engineer, 15 to 25 percent
  • One project manager, 10 to 15 percent throughout

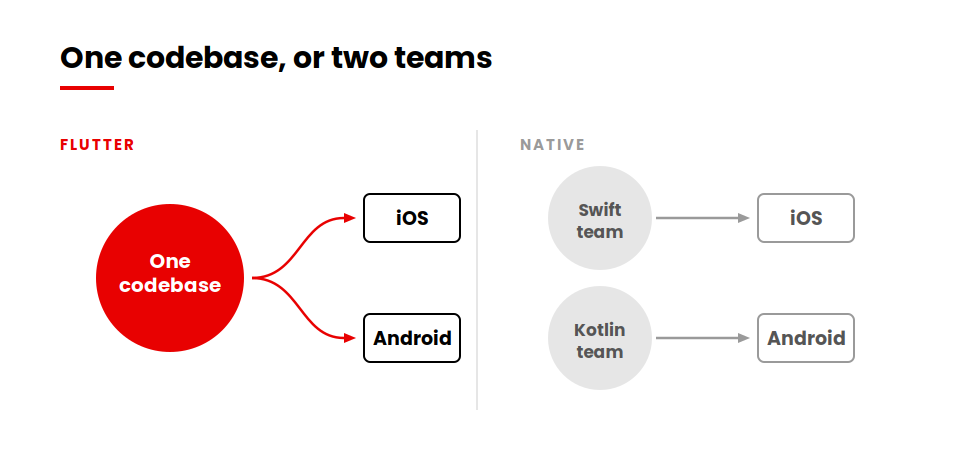
One Flutter codebase serving iOS and Android compared with two separate native teams

Monthly burn runs roughly $10,000 to $18,000 for a small offshore team, $22,000 to $38,000 for a mixed team, and $45,000 or more for a senior team based in the US.

Flutter vs Native App Development Cost: Where the Saving Comes From

Flutter costs 30 to 40 percent less than building the same app twice in Swift and Kotlin. That figure gets repeated everywhere, so it is worth showing where it actually comes from.

The 30–40% figure is repeated so often that it deserves an external corroboration. Rihards Baumanis and Maksims Peļņa, Development Leads at Chili Labs, who have shipped both Flutter and native, put development cost at 30–40% less in their own ROI breakdown, and they name the same caveat this article does: hardware-intensive apps still justify native.

Project Scope Flutter Native (iOS + Android) Saving
Scoped MVP $25,000 $42,000 40%
Customer-Facing App $60,000 $98,000 39%
Complex Platform $140,000 $225,000 38%
Enterprise Build $240,000 $360,000 33%

The saving comes from three places, and only one of them is the code.

Team size. A Flutter build needs 40 to 50 percent fewer developers, because you are not staffing two platform teams in parallel.

Time. Native takes 60 to 80 percent longer for the same feature set, since every screen is built twice.

Maintenance. This is the part that compounds. One codebase means one bug fix, one release, one regression test cycle.

A Number Worth Knowing

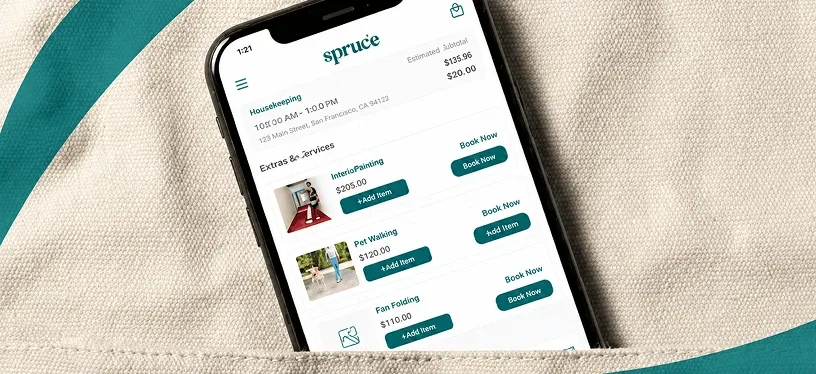
On Get Spruce, a React Native build serving 685,000 customers across five user roles, we measured 85 to 95 percent of native performance in production. Cross-platform performance stopped being the real objection some years ago. The trade-off now is about platform-specific capability, not speed.

When Flutter costs more than native

Being straight about this matters more than the saving does, because getting it wrong is expensive in both directions.

Flutter is the wrong call when your app depends on deep, platform-exclusive OS integration, when you are building something performance-critical like a 3D game or live video processing, or when you are shipping to one platform only and the second is not on the roadmap. It is also the wrong call when you already employ a strong native team, because you would be paying to retrain them.

In those cases a Flutter build ends up carrying platform-specific native code anyway, and you pay for the bridge on top of everything else.

Gautier, Flutter developer at Apparence (Apparence Kit, a Flutter-focused dev agency), author of “Flutter vs. React Native in 2025: Which One to Choose?” says, “For me, Flutter’s approach of owning its rendering pipeline often translates to more consistent visuals and performance.”

Still deciding between frameworks? Our breakdown of Flutter and React Native covers the trade-offs beyond cost.  

Hidden and Ongoing Flutter App Development Costs

The build price is the beginning of the spend, not the total.

Ongoing Cost Typical Range
Maintenance and Updates 15 – 20% of build cost per year
Apple Developer Program $99/year
Google Play Developer Account $25 one-time
Backend and Hosting $50 – $5,000/month, scaling with users
Analytics and Monitoring $0 – $500/month
Third-Party Services $100 – $2,000/month
Security Review $2,000 – $10,000/year

Budget 20 to 30 percent of your build cost annually for all of it. On a $60,000 app that is $12,000 to $18,000 a year, or roughly $1,200 a month once you average it out.

Maintenance is not optional and it is not padding. Apple and Google both ship breaking changes on an annual cadence, and an app that goes eighteen months without an update will start failing store review requirements.

Why Flutter Quotes Range From $5,000 to $300,000

Search this topic and you will see that spread quoted everywhere, usually presented as though it were a fact of nature. It is not. Four things explain nearly all of it, and once you can see them you can place any quote you receive.

Cause one: scope is defined at different depths

“A booking app” can mean a single calendar and a confirmation email, or it can mean multi-resource scheduling, cancellation policies, deposits, waitlists and a provider dashboard. Both are booking apps. One is $22,000 and one is $95,000.

Vendors quoting the low end are usually not being dishonest. They are answering the question you asked, at the depth you asked it.

Cause two: design is priced as an assumption, not a decision

An estimate built on Flutter’s default components and one built on a custom design system can differ by $30,000 before a single feature changes. Most quotes do not say which they assumed.

Cause three: the team’s region is invisible in the total

A $38,000 quote and a $115,000 quote can describe the same 700 hours of work. One is priced at $54 an hour in South Asia, the other at $164 an hour in the US. Neither figure tells you that unless you divide it out.

Cause four: backend is either included or quietly excluded

This is the one that causes real damage. A quote that covers the Flutter app and assumes you are supplying working APIs will always look cheaper than one that includes building them. If your backend does not exist yet, the cheaper quote is not cheaper. It is a partial answer that will be completed later, by invoice.

Where I actually see the variance: Of those four, backend scope accounts for more of the gap than the other three combined. In the last two years I have not seen a single pair of wildly different quotes where the backend assumption was the same in both.

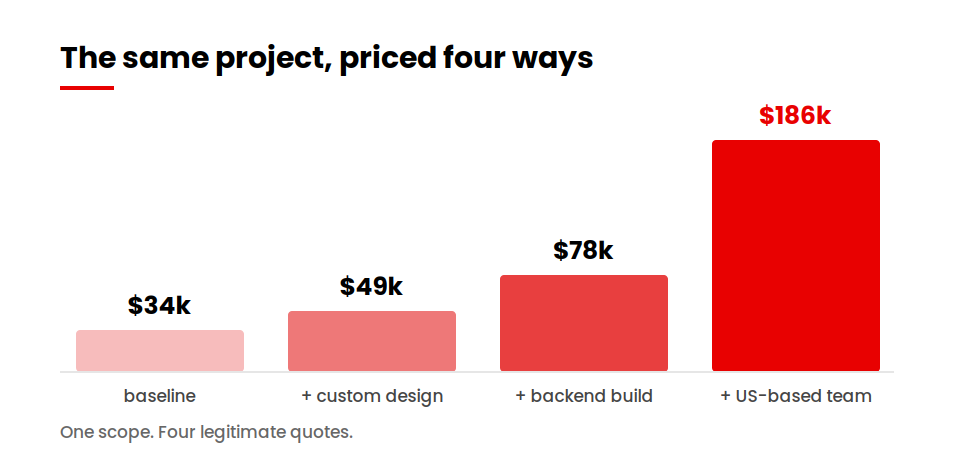
The same project, priced four ways

How four scope decisions move the same Flutter project from $34,000 to $186,000

Scenario Price
Baseline $34,000 — Customer app, default design, APIs already exist, South Asia team
Add Custom Branded Design $49,000
Add Backend Build From Scratch $78,000
Same Scope, US-Based Senior Team $186,000

Every one of those numbers is a legitimate quote for a Flutter app. Nothing dishonest happened between the first row and the last.

Not sure which tier your app sits in?

Run your feature list through our estimator and get a band in under two minutes, along with which of these four drivers is moving your number.


Estimate my Flutter build   → 

How to Read a Flutter App Development Cost Quote

This is the difference between comparing two numbers and comparing two projects.

What a complete estimate itemises

A quote you can actually evaluate will break out all seven of these, with hours or a sub-total against each:

  1. Discovery and scoping: requirements, user flows, technical spec
  2. UI/UX design: and which of the three design approaches it assumes
  3. Flutter development: front-end build, by feature or by screen
  4. Backend work: explicitly stated as included, excluded, or existing
  5. Third-party integrations: named individually, priced individually
  6. QA and testing: as its own line, with device coverage stated
  7. Deployment and post-launch support: store submission plus a defined support window

The five absences that signal an underscored bid

When a client forwards me a competing quote, these are what I look for first. Any one of them means the number in front of you is not the number you will pay.

  • No QA line. Testing is 15 to 25 percent of a build. A quote without it has either hidden it inside development hours or has not planned for it.
  • Backend unstated. If the document does not say whether APIs are included, assume they are not.
  • No device coverage named. “iOS and Android” is not a test plan. Which OS versions, which screen sizes, which devices?
  • No post-launch window. A build with no defined support period means the first crash report starts a new commercial conversation.
  • A single lump sum with no hours. You cannot compare a lump sum to anything. Ask for the hour breakdown before you compare it to a second quote.
The one I treat as disqualifying: a missing QA line. Everything else can be a formatting choice. Leaving QA out of an estimate is a statement about how the team works rather than a decision about price.

We use the same seven-part structure internally, which is described in more detail in our guide to software development cost estimation.  

Flutter budget qualifier

Get an estimate band in under two minutes

Question 1 of 5

Flutter App Development Cost in Practice: What We Build and What It Takes

Numbers in a table are easier to trust when you can see a real project behind them.

Dad Crafted Decor: when the app is the cheap part

Dad Crafted Decor refinishes kitchen cabinets. The problem they brought us was a sales problem rather than a software one. Customers could not picture a new finish on their own kitchen, so decisions stalled, and a stalled decision usually became no decision.

What we built lets a customer photograph their kitchen and see new textures and finishes applied to it. Behind that sits a custom detection model trained to find cabinets, drawers and fittings in a photograph and segment them, so a finish lands only where it belongs and not across the worktop.

The interesting part, for a cost conversation, is where the money went. The app layer was straightforward: take a photo, send it, show the result, let the customer compare options. The expensive part was the model, and specifically making it accurate on the photographs customers actually send.

The owner described the accuracy that mattered as accuracy on photos that are rarely clean. Kitchen photos taken on a phone have bad lighting, odd angles, clutter on the counter and half a fridge in frame. Training a model to segment cabinets reliably under those conditions is a different job from segmenting them in a showroom shot, and the distance between those two jobs was most of the budget.

That maps directly onto the feature table earlier in this article. AI features sit at $10,000 to $40,000 against $2,000 for a login, and the spread is not arbitrary. A login either works or it does not. A model has to work on the messy input your real customers produce, and that is where the hours go. If your app has a machine learning component, the Flutter layer is usually the cheapest thing you are buying.

You can see more of this work in our client case studies.

The Three-Year Cost of Owning a Flutter App

Build cost is the number everyone compares. Ownership cost is the number that decides whether the project was a good idea.

Here is a $60,000 Flutter app against the equivalent native build, over 36 months.

Cost Category Flutter Native (iOS + Android)
Initial Build $60,000 $98,000
Year 1 Maintenance (18%) $10,800 $17,640
Year 2 Maintenance $10,800 $17,640
Year 3 Maintenance $10,800 $17,640
Hosting and Services (36 Mo) $14,400 $14,400
Major OS Update Handling (x3) $9,000 $16,500
THREE-YEAR TOTAL $115,800 $181,820

The gap widens over time rather than closing. At build it is 39 percent. At three years it is 36 percent in percentage terms but $66,000 in cash, and almost all of the growth in that gap comes from maintaining one codebase instead of two.

One cost this table does not show, because nobody can predict it reliably: Flutter major version upgrades. Google ships them on a regular cadence, and each one carries some migration work. Budget a few thousand dollars a year against it rather than being surprised.

How to Reduce Flutter App Development Cost without Cutting Scope

Four things actually work. The rest is usually false economy.

Ship an MVP first.

Building the core workflow properly and adding the rest after real usage data cuts initial spend by 40 to 60 percent, and it stops you paying to build features nobody opens.

Sort features with MoSCoW.

Must have, should have, could have, will not have. Putting every feature into one of those four buckets before you request quotes typically defers 25 to 35 percent of the initial build.

Use the package ecosystem.

pub.dev hosts tens of thousands of community-maintained Flutter packages covering authentication, state management, networking and payments. Building those from scratch is money spent for no advantage.

Start on a managed backend.

Firebase or Supabase can remove $10,000 to $30,000 of initial backend work, and you can migrate to custom infrastructure later once you know your actual load.

What does not work: choosing the cheapest hourly rate available, skipping QA, or compressing the timeline. All three cost more in rework than they save in invoices.

If your conclusion is that the scope should be smaller, MVP development is the right starting point.  

Conclusion

The two quotes on your desk are probably both honest. They are describing different projects that happen to share a name.

Work out which of the four drivers each one has priced in, and the difference between them usually resolves into scope you either need or do not. That is a decision you can make. Comparing two totals is not.

If you want a number you can plan against, the fastest route is a scoped estimate rather than a range.

Get your Flutter build priced against real scope

We will break your requirements into the same tiers this article uses and show you what each one costs, itemised, before you commit to anything.

Explore our Flutter app development services →  

React Native App Development Cost in 2026: Explore With Four Real Builds

React Native app development costs $15,000 to $250,000, with most commercial builds landing between $40,000 and $100,000. Ask nine agencies and you will get nine numbers inside that range, which is not much help when you are trying to approve a budget.

What separates a $22,000 React Native app from a $180,000 one is rarely the framework. It is what the app has to talk to, how many kinds of user it serves, and one workflow decision most buyers make before anyone explains what it costs.

This piece prices four build we delivered as our React Native development services, names what drove each one, and covers the two React Native-specific decisions that move a budget more than feature count does.

Key Takeaways

  • Most React Native builds cost $40,000 to $100,000: An Expo-based MVP can start near $15,000, while enterprise platforms can exceed $150,000.
  • React Native reduces development costs: It can cost 30% to 40% less than separate native iOS and Android builds, with savings increasing as more user roles are added.
  • Choose Expo or bare workflow carefully: Deciding before understanding your native requirements can become one of the most expensive avoidable mistakes in a React Native project.
  • Native requirements can increase costs: Bluetooth, AR, background audio, and deep camera access may require native modules, adding roughly $15,000 to $40,000.
  • React Native can scale to millions of users: Coca-Cola Dubai used a ten-person team over nine months and more than 150 prototypes to reach 2 million peak users.

What React Native App Development Costs in 2026

React Native app development costs $15,000 to $250,000 in 2026. An MVP built on Expo with standard components starts near $15,000. A customer-facing app with accounts, payments and offline support typically runs $40,000 to $100,000. Enterprise platforms with multiple user roles, deep integrations and compliance requirements begin around $120,000.

Build Tier Cost Range Timeline What You Get
Expo MVP $15,000 – $40,000 6 – 12 weeks Standard components, managed workflow, one core journey, minimal backend
Mid-Range App $40,000 – $100,000 10 – 20 weeks Custom design, payments, push notifications, offline support, 20–30 screens
Complex Build $100,000 – $180,000 20 – 32 weeks Multiple user roles, native modules, third-party integrations, and admin tooling
Enterprise Platform $180,000+ 8 – 12 months Multi-surface product, high-concurrency backend, accessibility, and compliance work

The entry point for React Native sits lower than most cross-platform frameworks, and Expo is the reason. A managed workflow removes the native build configuration that used to consume the first two weeks of every project. That is a real saving, and it comes with a condition covered further down.

For cost bands across all app types rather than React Native specifically, our app development cost guide sets the wider context.

React Native App Development Cost by App Type

App Type Cost Range Main Cost Driver
Content or Booking App $20,000 – $50,000 Screen count and CMS integration
Ecommerce App $45,000 – $105,000 Catalogue, payments, order management
On-Demand or Marketplace $55,000 – $130,000 Two-sided flows, real-time tracking, dispatch logic
Logistics or Field Operations $60,000 – $140,000 Offline sync, GPS, role-based permissions
Multi-Role Operations Platform $90,000 – $200,000 Each distinct user role is close to a separate interface

That last row is the one people miss. Every user role you add is another set of screens, permissions and states. React Native saves you building them twice, which means the saving grows as roles multiply. There is a real example of that below.

Expo or Bare Workflow: The Decision That Moves Your Budget Most

This is the React Native question that has no Flutter equivalent, and almost nobody prices it.

React Native Expo versus bare workflow decision and the cost of switching later

Expo is a managed layer on top of React Native. It handles the native build configuration, over-the-air updates, and a large library of pre-built native capabilities, so a team can ship without touching Xcode or Android Studio. The bare workflow gives you the raw React Native project with full native access and full responsibility for configuring it.

Comparison Expo (Managed) Bare Workflow
Setup and Configuration 1 – 2 weeks
Access to Native Code Through config plugins Direct, unrestricted
Over-the-Air Updates Built in via EAS Build it yourself
Typical MVP Cost $15,000 – $40,000 $25,000 – $55,000
Adding an Unsupported Native SDK Config plugin, or eject Straightforward

Expo is the right default for most projects. The trap is not choosing it. The trap is choosing it without knowing whether your app will eventually need something Expo does not support, and discovering that in month four.

Even a successful bare-to-Expo migration hits capabilities that still demand pure native code. Alfred Lieth Årøe, who moved a seven-year-old bare app onto Expo, describes the edge case: “Since app extensions like widgets only have access to a very limited amount of RAM, less than what overhead React Native brings to the table, it is currently only possible to write them using pure native code.” 

What ejecting actually costs

Leaving the managed workflow mid-project means taking ownership of the native build configuration you had been avoiding, reconciling every config plugin against a raw native project, and rebuilding your release pipeline. On a project already underway, budget three to six weeks and expect the work to land on your most senior developer.

That is $15,000 to $35,000 of unplanned spend, and it lands at the worst point in a timeline, when scope is fixed and a launch date is already public.

My position on this: Start on Expo unless you already know you need something it does not support. Then spend one afternoon in discovery listing every hardware capability, SDK and background behaviour the app will need in its first two years, and check each one against Expo’s supported list before you write a line of code. That afternoon is the cheapest insurance in a React Native project.

Not sure whether you need bare React Native?

Answer a few questions about what your app has to talk to and get a workflow recommendation with the cost implication attached.

Check my workflow   → 

What Drives React Native App Development Cost

Four things, in order of impact.

Feature scope. A login with email and password is a day. A login with four social providers, biometric fallback, cross-device session management and two-factor is two weeks. Both are called login on a feature list.

Feature Typical Cost
Authentication (Basic) $2,000 – $3,500
Social and Biometric Login +$2,500 – $5,000
Payments (Single Gateway) $3,000 – $6,000
Push Notifications $2,000 – $3,500
Real-Time Chat $9,000 – $16,000
Offline Mode with Sync $8,000 – $20,000
Live Video $12,000 – $30,000
Each Third-Party SDK $1,500 – $6,000

Design depth. Standard components cost nothing extra. A branded design system runs $8,000 to $20,000. Fully custom interfaces with animation reach $35,000.

Backend. If you have working APIs, the React Native app is a front end. If you do not, you are buying a backend alongside it, and that is frequently 40 percent of the total.

User roles. Covered above, and demonstrated below.

For a framework you can use to compare two quotes line by line, our Flutter cost guide sets out the seven items a complete estimate itemises. The same test applies to React Native.  

When React Native Forces You into Native Code

React Native renders real native components, which is why it feels closer to native than older hybrid approaches. It does not give you access to everything, and the gap is where budgets break.

You will need native module work when your app requires:

Capabilities that require native module work in a React Native app

  • Bluetooth Low Energy for hardware pairing, beacons or medical devices
  • Augmented reality through ARKit or ARCore
  • Background audio or location running reliably when the app is closed
  • Deep camera control such as manual focus, RAW capture or frame-level processing
  • Platform-exclusive frameworks including HealthKit, CarPlay, Android Auto and Wear OS
  • A vendor SDK with no React Native wrapper, common in payments hardware, industrial equipment and older enterprise systems

When any of these is in scope, budget $15,000 to $40,000 on top of the feature estimate. The work is real native development in Swift and Kotlin, bridged into your JavaScript codebase, and it needs someone who can write both.

The useful part is that this list is knowable in advance. Every item is a product decision, not a technical surprise. Walk your feature list against it during discovery and the number stops being a risk and becomes a line item.

React Native Developer Rates and Team Structure

Region Mid-Level Senior Lead / Architect
US and Canada $95 – $145/hr $145 – $195/hr $195 – $250/hr
Western Europe $75 – $115/hr $115 – $155/hr $155 – $195/hr
Eastern Europe $45 – $80/hr $80 – $115/hr $115 – $150/hr
South Asia and Southeast Asia $28 – $50/hr $50 – $80/hr $80 – $115/hr

React Native teams have one composition quirk worth knowing. Because the codebase is JavaScript, teams often assume web developers can staff it. They can write the code. What they usually cannot do is diagnose a native crash, tune a list that stutters on a mid-range Android device, or decide whether a problem belongs in JavaScript or in a native module. Budget for at least one person who has shipped React Native to both stores.

For scale, the Coca-Cola Dubai platform ran with a ten-person design and engineering team over nine months. That is roughly 90 person-months, and it is what an enterprise-tier React Native build actually looks like in staffing terms.

React Native vs Native App Development Cost

Project Scope React Native Native (iOS + Android) Saving
MVP $28,000 $46,000 39%
Mid-Range App $70,000 $115,000 39%
Complex Build $140,000 $220,000 36%
Enterprise Platform $220,000 $330,000 33%

The saving narrows as complexity rises, because complex apps are more likely to need native modules, and native module work is priced the same either way.

Native wins outright when you need pixel-level platform-specific interface work, heavy use of platform APIs like ARKit or HealthKit, or single-platform delivery with no second platform planned.

If you are specifically weighing React Native against Swift for an iOS-first product, we cover that comparison in React Native vs Swift.  

Four React Native Builds and What Drove the Cost of Each

Every other page on this topic prices hypothetical apps. Here are four real ones.

Coca-Cola Dubai: discovery was the line item

The stack was React Native on the front end with Node.js, PostgreSQL and AWS behind it. The platform was engineered over nine months by a ten-person design and engineering team and reached more than 2 million peak users at 99.98% uptime, with user journeys 45% faster than the previous experience, AA accessibility compliance and zero critical bugs at launch.

The number that explains the budget is not any of those. It is 150+ prototypes.

For a brand at that scale, the expensive part was not building the app. It was establishing what to build, validating it, and proving it would hold at peak load before a single production user arrived. Discovery and prototyping consumed a share of that nine months that would look extravagant on a startup project and was proportionate here, because the cost of shipping the wrong experience to 2 million people is larger than the cost of prototyping it 150 times first.

The transferable point: at enterprise scale, prototyping is not a design cost. It is risk reduction, and it is priced accordingly.

The full decision story is in why we chose React Native for Coca-Cola Dubai.

The scale objection, answered: 2 million peak users at 99.98% uptime on React Native. When someone tells you the framework will not hold at scale, that is the number to put in front of them.

Get Spruce: five roles, one codebase

Get Spruce serves 685,000 customers across five distinct user roles, each with its own permissions and interface, plus a separate Service Pro app for operators. We measured 85 to 95 percent of native performance in production.

Five roles is where cross-platform economics change shape. A single-role consumer app saves roughly the 35 percent the comparison table predicts. Five roles means five sets of screens and states you would otherwise have built twice, so the saving compounds rather than staying flat.

The cross-platform discount is usually quoted as a fixed percentage. It is not fixed. It scales with the number of distinct interfaces your product needs.

Lulo Freight: inheriting someone else’s codebase

Lulo Freight came to us after a previous development partner failed to deliver to scope. We took over the codebase and completed the platform: a load board, real-time tracking, instant quoting, and a carrier-side interface handling capacity matching, payments and driver operations.

Rescue projects price differently from new builds, and nobody on this topic explains how. Before any feature work begins, someone has to read the existing code, establish what works, and find what has been implemented incorrectly rather than incompletely. That audit is typically two to four weeks on a mid-sized codebase, and it is the most valuable money you will spend on a rescue.

What the Lulo build taught us about pricing rescues: The audit fee is the one line item a client always wants to cut, and cutting it is what turns a takeover into a rewrite. You cannot quote a fix accurately until you know what is broken, and guessing costs more than looking.

CPCG: React Native was one surface of three

CPCG replaced five separate tools in eight weeks with a system that ran across three surfaces at once. A React Native app, an Electron kiosk application, and a desktop application for operators, carrying live video, remote desktop control, recorded call logs and request alerts between them.

The React Native app was the cheapest of the three. Multi-surface products get quoted as though the mobile app is the project, and it rarely is. What costs money is keeping three clients in agreement about the same live session state.

What the four have in common

The React Native layer was the predictable part of all four estimates. What moved the numbers was 150 prototypes, five user roles, an inherited codebase and three simultaneous surfaces. When you compare two React Native quotes, the front-end hours are rarely where the difference lives.

The New Architecture: React Native’s Upgrade Cost

React Native has been migrating to what Meta calls the New Architecture, replacing the old JavaScript-to-native bridge with Fabric for rendering and TurboModules for native calls. It is faster and it is where the framework is going.

For a 2026 build it carries two budget implications.

If you are starting fresh, build on the New Architecture from day one. There is no migration to pay for later, and the ecosystem has largely caught up.

If you have an existing app, migration cost depends almost entirely on your dependency list rather than your own code. Libraries that have not been updated need replacing or forking. A well-maintained app with mainstream dependencies is a few weeks. An app carrying four years of accumulated packages, some abandoned, can be considerably more.

Shopify, which has migrated two of its largest apps to the New Architecture, put the dependency problem precisely: “For third-party dependencies that did not simultaneously support both architectures on a single version, we used feature flags to conditionally disable functionality in development mode on the new architecture.” – Thiago Magalhaes, Staff Engineer at Shopify.

The practical guidance is to audit your dependency list before committing to a number. It is the only part of the migration anyone can estimate accurately in advance.

Hidden and Ongoing React Native App Costs

Ongoing Cost Typical Range
Maintenance and Updates 15 – 20% of build cost per year
Apple Developer Program $99/year
Google Play Developer Account $25 one-time
Backend and Hosting $50 – $5,000/month
Expo EAS (If Used) $0 – $100+/month by usage
Third-Party Services $100 – $2,000/month

Budget 20 to 30 percent of build cost annually.

One React Native cost is worth calling out separately: library churn. React Native leans harder on community packages than most frameworks, and those packages age at different rates. An app running twelve third-party libraries will have two or three needing attention each year, and occasionally one will be abandoned and need replacing outright. That is ordinary maintenance rather than a defect, but it is real hours and it belongs in the annual figure.

How to Reduce React Native App Development Cost Without Cutting Scope

Start on Expo if your capability list allows it. Days rather than weeks of setup, and you keep over-the-air updates without building them.

Ship one journey properly. An MVP that does one thing well cuts initial spend by 40 to 60 percent and tells you which of the remaining features anyone actually wants.

Use maintained community packages. React Native’s ecosystem covers navigation, state, payments and media well. Building those yourself buys nothing.

Check your native requirements during discovery. The single most expensive React Native mistake is discovering a native dependency in month four. One afternoon against the trigger list above prevents it.

What does not work: hiring web developers because the codebase is JavaScript, skipping the rescue audit on an inherited project, or compressing a timeline. Each costs more in rework than it saves.

If the answer is a smaller first release, MVP development is the place to start.

Conclusion

In all four builds above, the React Native layer behaved exactly as estimated. The variance came from prototyping, role count, an inherited codebase and surface count, and none of those is a framework question.

When you are holding two quotes, look past the development hours and find what each one assumed about those four things. That is where the difference lives, and it is a difference you can actually evaluate.

Not sure whether you need bare React Native?

Answer a few questions about what your app has to talk to and get a workflow recommendation with the cost implication attached.

Check my workflow   →