













 ChatGPT
 Perplexity
 Claude
 Google AI
Mobile app maintenance costs run 15–20% of the original build cost every year once the app is stable, and 30–50% in year one while the codebase settles. For a $120,000 app, that is roughly $36,000 to $60,000 in the first twelve months and $18,000 to $24,000 a year after that. The money goes to six recurring places: cloud hosting and infrastructure, Apple Developer Program and Google Play Console fees, crash monitoring and analytics tooling, third-party SDK and API subscriptions, security patching and compliance work under HIPAA, PCI DSS or GDPR, and developer hours for OS compatibility releases. What moves the number is rarely app size. It is architecture, how many third-party dependencies you carry, whether you maintain one codebase or two, and who owns your backend.
This guide breaks down what each line item costs, how to forecast your own figure, and what a maintenance agreement should specify before you sign it. I have scoped a lot of these conversations. The pattern is consistent: someone arrives with a quote in hand, a percentage rule they read somewhere, and no way to tell whether the two match. What follows is how I work that out.
Key Takeaways
- Steady-state mobile app maintenance costs run 15–20% of the original build cost per year. Year one typically runs 30–50% while the codebase settles.
- Most live apps sit between $500 and $5,000 a month. Regulated or real-time apps in healthcare, fintech and on-demand run $5,000 to $20,000 and above.
- Six recurring line items carry almost the whole bill: hosting, app store fees, monitoring, third-party services, security and compliance, and developer hours.
- Architecture drives the number harder than feature count. Two native codebases, a deep third-party dependency tree, and no automated tests are the three largest multipliers.
- On a $150,000 build, cumulative maintenance passes the original build cost early in year five.
- Emergency fixes bill at three to five times planned rates, which makes an agreed response-time SLA a cost control rather than paperwork.
How Much Does Mobile App Maintenance Cost?
Plan for 15–20% of your original build cost per year once the app is stable, and 30–50% in the first twelve months. The first year runs high because real users find defects that testing did not, and because the team is still learning the production behaviour of a system it only ever saw in staging.
Here is what those percentages look like in dollars.
| Initial Build Cost | Year One (30–50%) | Steady-State Annual (15–20%) | Steady-State Monthly |
|---|---|---|---|
| $50,000 | $15,000 – $25,000 | $7,500 – $10,000 | $625 – $835 |
| $100,000 | $30,000 – $50,000 | $15,000 – $20,000 | $1,250 – $1,670 |
| $150,000 | $45,000 – $75,000 | $22,500 – $30,000 | $1,875 – $2,500 |
| $250,000 | $75,000 – $125,000 | $37,500 – $50,000 | $3,125 – $4,170 |
| $500,000 | $150,000 – $250,000 | $75,000 – $100,000 | $6,250 – $8,335 |
The percentage is a starting anchor. It works because build cost is a rough proxy for how much system there is to keep alive, and it fails whenever that proxy breaks, two apps built for the same money can differ by a factor of three in what they cost to run, which is why the rest of this article is about the factors underneath the number rather than the number itself.
If you do not have a build figure to apply the percentage to, start with what the build itself costs and work forward from there.
Where the Money Goes: The Six Recurring Line Items
Split your mobile app maintenance budget into two halves before you do anything else. One half runs whether or not a single line of code changes. The other half only bills when someone is actually working on your app.
That split is the most useful thing I can give a founder in a first conversation, because it tells you which costs you can forecast to the dollar and which ones move.
Costs that run on their own
- Cloud hosting and infrastructure. Small apps with a few hundred users sit around $70–$320 a month. Mid-size apps with steady traffic land at $500–$2,000. Apps handling real-time data or thousands of concurrent users climb past $2,000 and keep going as capacity scales.
- App store fees. The Apple Developer Program is $99 a year. Google Play Console charges a one-time $25 registration fee. These are the smallest and most predictable numbers on the list.
- Monitoring and analytics. Crash reporting and performance tooling — Crashlytics, Sentry, Datadog — runs anywhere from free at low volume to $200–$1,500 a month once you are tracking sessions at scale.
- Third-party services. Every SDK and paid API in your stack bills monthly: payment processing, push notifications, mapping, authentication, SMS, email. Budget $200–$2,000 a month depending on how many you carry.
Costs that bill when someone works
- Developer hours for OS compatibility. Apple and Google ship major releases every year. Each one can deprecate an API you depend on, and skipping enough of them gets your listing pulled. This is the line item first-time budgets leave out. Our guide to building and maintaining an iPhone app covers what a release cycle actually involves.
- Security patching and compliance. Routine patching runs $250–$500 per update. A professional security audit runs $1,000–$5,000. A full penetration test on a complex app runs $5,000–$15,000 and up.
Infrastructure and tooling will cost you a few hundred to a few thousand dollars a month no matter what. Developer hours are what actually move your annual number, and they are the only part of the bill you have real control over.
App Maintenance Cost by Complexity: Simple, Mid-Market and Enterprise
The tier your app sits in tells you more than its feature list does. Here is where the three bands land.
| App Tier | Typical Examples | Monthly | Annual | Share of Build |
|---|---|---|---|---|
| Simple | Content apps, booking tools, single-purpose utilities, internal apps | $500 – $1,500 | $6,000 – $18,000 | 12–18% |
| Mid-market | E-commerce, marketplaces, apps with user accounts, payments and a handful of integrations | $1,500 – $5,000 | $18,000 – $60,000 | 15–22% |
| Complex, regulated or real-time | Healthcare, fintech, logistics dispatch, on-demand platforms, anything with live data or audit obligations | $5,000 – $20,000+ | $60,000 – $240,000+ | 20–35% |
Most of the companies I work with sit squarely in the middle band and get costed as though they belong in one of the other two. The guidance written for solo developers underestimates what an app with payments and a real user base takes. The guidance written for enterprise buyers assumes a compliance and procurement overhead that a forty-person company does not carry.
Platform choice shifts the tier boundaries too. A cross-platform build maintained as one codebase sits lower than two native apps of the same scope, and the gap widens every year as both platforms ship releases. If you are still deciding, iPhone app development costs break down the same arithmetic on the build side.
What Each Type of Maintenance Actually Costs
The international standard for software maintenance, ISO/IEC 14764, sorts this work into four categories. In practice there is a fifth, and it is the one that wrecks budgets.
| Type | What Triggers It | Typical Cost | Planned? |
|---|---|---|---|
| Corrective — fixing defects | Bug reports, crashes, broken flows | $1,000 – $5,000 per fix cycle; 20–30% of the annual budget | Semi-planned |
| Adaptive — keeping up with the outside world | Annual iOS and Android releases, deprecated APIs, SDK version bumps | $2,000 – $10,000 per platform per year | Planned |
| Preventive — reducing future work | Dependency upgrades, refactors, documentation, test coverage | $1,000 – $5,000 per quarter | Planned |
| Perfective — improving what exists | User feedback, UX refinement, performance tuning | $5,000 – $25,000 per enhancement | Planned, scoped separately |
| Emergency — something is on fire | Outage, security incident, store removal, payment failure | Three to five times standard rates: $300–$1,000 an hour against a typical $100–$200 | Unplanned |
Preventive maintenance is the category people cut first and regret most. Every dependency upgrade you defer becomes a larger upgrade later, because the version gap grows and the migration path gets longer. That is technical debt in its most literal form, you are paying interest on work you chose not to do.
Year One vs Steady State, and the Five-Year Total
The single most useful thing you can do with a maintenance budget is model it across the whole product life rather than one year at a time. Here is a $150,000 build carried through five years at mid-range percentages.
| Year | Annual Maintenance | Cumulative | Cumulative as % of Build |
|---|---|---|---|
| Year 1 | $60,000 (40%) | $60,000 | 40% |
| Year 2 | $27,000 (18%) | $87,000 | 58% |
| Year 3 | $27,000 (18%) | $114,000 | 76% |
| Year 4 | $30,000 (20%) | $144,000 | 96% |
| Year 5 | $33,000 (22%) | $177,000 | 118% — CROSSOVER |
Cumulative maintenance passes the original build cost early in year five. That is the number I want in front of every founder before they sign a development contract, because it reframes the build as roughly half of what the product will cost you.
Two things drive the curve back upward in years four and five. Dependencies drift further from current versions the longer the app runs, so each upgrade costs more than the last. And the people who built it have usually moved on, so every change now starts with someone reading unfamiliar code.
THE FINDING THAT CHANGES BUDGETS: Across a normal five-year product life, you will spend more keeping the app alive than you spent building it. Plan the maintenance line before you sign the build contract, not after.
Daniel D. Galorath, founder and CEO of Galorath Incorporated and author of Software Sizing, Estimation, and Risk Management, puts software maintenance at roughly 75% of total cost of ownership across a system’s life. His firm’s position, presented at the ISPA/SCEA international conference, is that decisions made during development, specifically maintainability decisions, are the dominant lever on total ownership cost.
That matches what I see. By the time someone calls me about a maintenance bill, the number was mostly set two years earlier, in architecture choices nobody thought of as budget decisions.
Compliance Costs: What HIPAA, PCI DSS and GDPR Add to Maintenance
Regulated apps carry a maintenance load that has nothing to do with features. Compliance work is recurring by design: evidence has to be regenerated, controls have to be re-tested, and vendor agreements have to be re-signed.
| Regulation | What It Adds to Ongoing Work | Annual Cost |
|---|---|---|
| HIPAA | Business associate agreements with every vendor touching patient data, audit logging, annual risk assessment, encryption review | $20,000 – $60,000 |
| PCI DSS | Quarterly vulnerability scans by an approved vendor, annual self-assessment or report on compliance, tokenisation upkeep | $15,000 – $40,000 |
| GDPR / CCPA | Consent management, data subject access request handling, records of processing, annual review | $8,000 – $25,000 |
| SOC 2 Type II | Continuous control monitoring, evidence collection, annual audit fee | $25,000 – $60,000 |
| COPPA | Age gating, parental consent flows, data minimisation review | $10,000 – $30,000 |
Two of these stacking is common and the cost is not additive in the way people expect, a healthcare app taking card payments carries HIPAA and PCI DSS, and the shared evidence work between them saves less than you would hope, because the auditors are different and the control sets barely overlap.
If you are budgeting a regulated build from scratch, healthcare app development costs cover the compliance overhead on the build side.
The Maintenance Load Score: Six Factors That Set Your Mobile App Maintenance Cost
Percentages tell you what a typical app costs. This tells you what yours costs.
Score your app on each of the six factors below, from 0 to 3. Add them up. The total maps to a predicted annual band.
| Factor | 0 Points | 1 Point | 2 Points | 3 Points |
|---|---|---|---|---|
| 1. Codebases you actively maintain | One cross-platform | One native | Two native | Three or more, incl. web or wearable |
| 2. Paid third-party SDKs and APIs | 0–2 | 3–5 | 6–10 | 11 or more |
| 3. Who runs your backend | Fully managed service | Managed plus a few custom services | Self-managed cloud servers | Own infrastructure or hybrid |
| 4. Automated tests and CI/CD | Both, with meaningful coverage | Pipeline only, thin tests | One or the other | Neither; manual releases |
| 5. Regulatory surface | None | GDPR or CCPA | PCI DSS or SOC 2 | HIPAA, or two or more regimes |
| 6. Release cadence | Quarterly or less | Monthly | Fortnightly | Weekly or faster |
Your score, and what to budget:
| Total Score | Predicted Annual Maintenance |
|---|---|
| 0 – 4 | 12–15% of build cost |
| 5 – 8 | 15–18% |
| 9 – 12 | 18–25% |
| 13 – 15 | 25–32% |
| 16 – 18 | 32–40% and above |
Factor one is where most of the spread comes from. Two native codebases means every fix, every OS release and every dependency upgrade happens twice, on two release cycles, with two sets of platform-specific defects. If you are early enough to still be choosing, maintaining one codebase instead of two is the largest single cost decision available to you.
The effect is large enough that our own software development cost estimation guide puts a poorly architected $100,000 build at around $40,000 a year to maintain, against roughly $20,000 a year for a well-built $150,000 one. The bigger project is the cheaper one to keep alive.
Factor four is the one clients push back on hardest and the one I defend most. Automated tests feel like a cost during the build and behave like a discount for the rest of the product’s life, because a regression caught by a pipeline costs minutes and the same regression caught by a user costs a hotfix release.
WHAT SURPRISES PEOPLE MOST: The factor that pushes a quote higher than expected is almost never the feature list. It is the dependency count. An app carrying eleven paid SDKs has eleven vendors who can change their terms, deprecate an endpoint or raise a price without asking you.
How to Calculate Your Mobile App Maintenance Cost in Four Steps
The Load Score gives you a percentage. These four steps give you a figure you can defend line by line in a budget meeting.
Step 1 — Inventory every recurring subscription.
Open a spreadsheet with two columns: service and monthly cost. List hosting, database, CDN, storage, payment gateway, push notifications, analytics, crash reporting, authentication, email, SMS, maps. If it bills, it goes on the list. Most teams find two or three services nobody remembers signing up for.
Step 2 — Project infrastructure against twelve months of growth.
Find your hosting provider’s next pricing tier and work out what usage level triggers it. If you are at 5,000 users and expect 20,000, price that tier now rather than discovering it on an invoice.
Step 3 — Estimate labour by task type.
Take the recurring work; minor fixes, performance tuning, third-party API updates, the annual OS compatibility release, security patches, and estimate hours for each at your team’s blended rate. The OS release is usually the biggest single block and the one people forget.
Step 4 — Apply your Load Score band and reconcile.
Multiply your build cost by the predicted percentage from the table above. Compare it against the total from steps one to three. If the two figures are more than 30% apart, one of them is wrong, and it is usually step three, because labour estimates run optimistic.
Work out your own number first
Run your build scope through the app cost calculator to get a baseline, then apply your Load Score band to it.
Open the app cost calculator
In-House vs Agency Retainer vs Freelance: Annual Cost Compared
Three ways to staff maintenance, three very different cost shapes. The comparison below assumes a mid-market app needing roughly 20 to 40 hours of work a month.
| Delivery model | Annual cost | What you get | What you do not get | Best fit |
|---|---|---|---|---|
| In-house engineer | $170,000 – $215,000 fully loaded (base $130k–$165k plus payroll tax, benefits, equipment, tooling) | Deep product knowledge, immediate availability, full control | Multi-skill coverage. One mobile engineer is not also a backend, QA and DevOps engineer. You also pay for idle capacity in quiet months | Companies where the app is the product and 40+ hours a month of work genuinely exists |
| Agency retainer | $30,000 – $96,000 ($2,500 – $8,000 a month for 20–60 hours) | A mix of iOS, Android, backend, QA and DevOps skills. Cover during leave. Contracted response times | Instant context on a codebase they did not write, unless you fund a handover | Most mid-market apps. Predictable, and scales down without a redundancy conversation |
| Freelance or ad-hoc | $12,000 – $40,000 (US $60–$150/hr; offshore $30–$70/hr) | The lowest cost in quiet months | Guaranteed availability, cover, or an SLA. Emergency work is charged at a premium and you are behind whoever is on retainer | Simple apps that are stable and not business-critical |
The honest comparison is between an in-house hire and a retainer, and it turns on one question: does 40 hours a month of genuine maintenance work exist? If it does, a hire is usually better value and you get the product knowledge for free. If it does not, you have hired a full-time engineer who will drift into feature work, which is how maintenance quietly stops happening.
What a Mobile App Maintenance Contract Should Cost You to Include
The number matters less than what sits behind it. Here is what I tell clients to get in writing before they sign anything, whoever they sign it with.
- Severity levels defined. What counts as critical, high, medium and low, with an example of each.
- Response time per severity. How long until someone acknowledges the issue.
- Resolution target per severity. How long until it is fixed, or until you get a workaround and a plan.
- Coverage hours. Business hours in which time zone, and what happens at 2am on a Saturday.
- What is included versus billable. Bug fixes in, new features out — and who decides which one a given request is.
- Hours bank and rollover. How many hours a month, whether unused hours roll forward, and for how long.
- Rate for work beyond the retainer, and the emergency rate, stated as a number.
- Change request process. How new work gets scoped, quoted and approved.
- Code and account ownership. Repository, cloud accounts, app store listings, signing certificates and API keys all in your organisation’s name, with the vendor granted access.
- Documentation obligations. What gets written down, and where it lives.
- Exit and handover. Notice period, what gets transferred, how long handover support runs, and at what rate.
- What you receive each month and in what format.
Ownership is the clause that costs the most when it is missing. If a vendor holds your signing certificate or your App Store account, moving away from them is a project rather than a decision. I have watched that take three months.
The other clause worth reading slowly is the uptime commitment. Most of them exclude outages caused by third-party services, which on a typical mobile app is most of what can go wrong. Read the exclusions before the headline percentage.
If you are at the stage of comparing providers, how to vet a development partner covers the evaluation criteria that apply to maintenance work as much as to a build.
Mobile App Maintenance Cost in Practice: What Fragmented Architecture Actually Costs
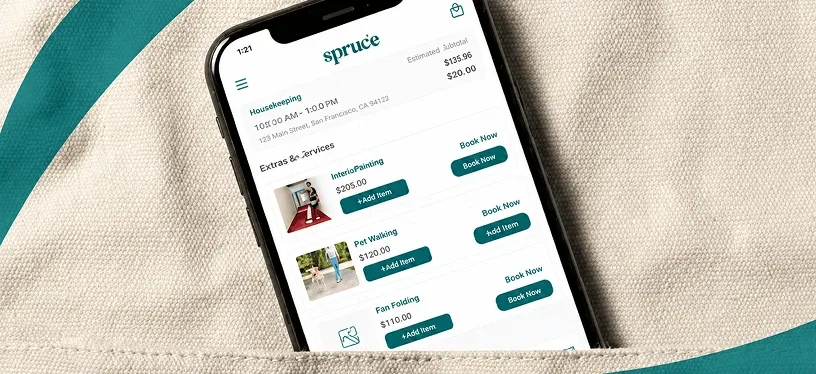
Spruce is a US home and property services platform. Residents, property managers and service professionals book cleaning and chore services through it, and the business runs across a resident mobile app plus separate web portals for admins, providers and property managers.
By the time the work came to us, the cost of that shape had become the problem. The architecture had grown in pieces rather than being designed as a system, and the practical effect was that routine changes had stopped being routine. Every update had to be reasoned about across multiple surfaces, and the team could not confidently predict what a change would touch.
Two things were structurally expensive. Service professionals had no mobile app at all, so work that belonged in an app was being handled through channels that needed manual support. And there was no capacity management, which meant overbooking was resolved by people rather than by the system — a support cost that scales with growth.
What we did was a full system redesign rather than a series of patches: role-specific workflows across mobile and web, a capacity management layer, and a structured pricing model that adjusted by region, floor plan and square footage instead of being maintained by hand.
The transferable lesson has nothing to do with home services. Spruce’s maintenance burden was set by architecture, not by feature count — multiple surfaces, fragmented ownership, and manual processes standing in for missing system logic. That is factors one, three and four of the Load Score, showing up as a monthly bill.
You can see more of the platform rebuilds we have delivered if it helps to see the pattern across other industries.
What Your Maintenance Budget Does Not Cover
This is the part I would rather you read from me than discover in month four.
New features are not maintenance. A retainer keeps what exists working. Anything that adds functionality is a change request, scoped and priced separately. Teams that blur the line end up funding features out of the maintenance budget, and then the security patches get deferred until next month, six months running.
Re-platforming is not maintenance. Moving from one framework to another, rebuilding the backend, or migrating to a different cloud provider are projects. The 15–20% figure does not cover them and was never meant to.
A major framework migration is not maintenance either. When a framework ships a breaking major version, the upgrade is scoped work. Budget it separately the year it lands.
An SLA does not cover third-party outages. If your payment provider goes down, your app is down, and almost no maintenance agreement makes the vendor liable for that. What a good agreement gives you is someone who notices quickly and communicates while it is happening.
Design refreshes are not maintenance. Keeping the interface working is maintenance. Making it look current is a project.
MY TAKE: The mistake I spend the most energy heading off is treating the maintenance retainer as the feature budget. It works for about a quarter. Then the roadmap stalls and the patches are three months behind, and you have paid for both problems at once.
Conclusion
The percentage rule is a starting point. Fifteen to twenty percent of build cost tells you roughly what to reserve, and tells you nothing about why your number sits at the top of that band instead of the bottom.
That answer lives in your architecture, how many codebases you maintain, how deep your third-party dependency tree runs, who owns your backend, and whether anything automated catches a regression before a user does.
Score your app against the six factors, put a defensible figure in next year’s budget, and take the contract checklist into your next conversation with whoever maintains your app. The number matters far less than knowing what you are buying with it.
Not sure what your app should cost to maintain?
We will score your current architecture against the six factors above and give you a maintenance figure you can put in a budget, with the scope behind it written out.