







The 7 Phases of App Development and How Long Each Takes

App development runs through seven phases in a fixed order: discovery, design, architecture, development, testing, launch, and post-launch support. A mid-complexity build on a single platform takes four to seven months to move through all seven.

I spend most of my week between a delivery team and a client who wants to know why week fourteen looks a lot like week eleven did. That conversation has taught me more about schedules than any project plan has.

The pattern is consistent. Schedules slip in the phases where decisions get made, and they slip quietly. By the time a delay is visible in the build, it has usually been sitting in the plan for a month.

This guide gives you a duration range for each of the seven phases, the deliverable that proves a phase actually closed, and the specific reason each one runs long.

A phase is finished when the thing it was supposed to produce exists. Everything else is a status update.

Key Takeaways

  • Follow the Seven Development Phases:
    A complete mobile app project typically moves through discovery, design, architecture, development, testing, launch, and post-launch support in sequence.
  • Plan for a Four-to-Seven-Month Timeline:
    A mid-complexity, single-platform app commonly takes around four to seven months when all seven phases are properly accounted for.
  • Development Takes the Largest Share:
    Development generally consumes about half of the overall schedule, while technical architecture is often the shortest phase and one of the most frequently overlooked in project plans.
  • Never Compress Testing Too Aggressively:
    Testing is commonly shortened to meet deadlines, but reducing QA time can create expensive quality issues and increase the cost of fixing problems later.
  • Account for Launch and Review Time:
    App store approval can add unavoidable time to the schedule, so teams should include a launch buffer rather than planning for an immediate go-live after submission.
  • Use Phase Exit Tests:
    Track progress by confirming that each development phase has produced its required deliverable before moving to the next stage, helping prevent gaps and costly rework.

What Are the 7 Phases of App Development?

The seven phases of app development are discovery and requirements, UX and UI design, technical architecture, development, quality assurance and testing, launch and app store review, and post-launch support. Each phase produces a specific artifact that the next phase depends on.

Skipping the artifact moves the work later, where it costs more. I have watched teams leave a written integration map out of the plan and pay for it in month four, when an assumption about a third-party system turns out to be wrong.

The order holds firmer than a project plan sometimes implies. Design closes after scope settles, and testing closes after a build exists. What varies between projects is how much the mobile app development stages overlap.

For what happens inside each phase, our mobile app development guide covers the work itself. This guide covers how long that work takes.

How Long Each App Development Phase Takes

A mid-complexity single-platform build runs four to seven months from kickoff to store approval. The table below breaks that total into phases.

Phase Typical Duration Share of Schedule What It Must Deliver
Discovery and requirements 2 to 4 weeks 8 to 12 percent Signed scope document
UX and UI design 3 to 5 weeks 12 to 18 percent Clickable prototype, all scoped screens
Technical architecture 1 to 3 weeks 5 to 8 percent Stack decision and integration map
Development 10 to 18 weeks 45 to 55 percent Working build against approved designs
Quality assurance and testing 3 to 6 weeks 12 to 18 percent Defect log with severities cleared
Launch and app store review 1 to 2 weeks 4 to 6 percent Approved build live on the store
Post-launch support Ongoing Not applicable Monitoring, patches, iteration

Read this table phase by phase. Architecture and design overlap on most projects, and testing runs alongside development, which is why the individual ranges sum higher than the four to seven month calendar total.

Phase by Phase: What Each One Delivers and What Delays It

Each of the seven mobile app development phases below carries a duration range, the artifact that closes it, and the reason it runs long.

Phase 1: Discovery and Requirements, 2 to 4 Weeks

Discovery produces the scope document everything else gets built against. The work is stakeholder interviews, feature prioritization, technical feasibility checks, and a written definition of what version one includes.

This is the phase sponsors most often want to cut, and the one I push back on hardest. Every week removed here comes back as two to four weeks of rework during development.

The ambiguity survives the deletion. It surfaces later, after code has been written against a guess.

Phase 2: UX and UI Design, 3 to 5 Weeks

Design produces a clickable prototype covering every screen in the approved scope. It covers user flows, wireframes, visual design, and a design system the developers build against.

Design runs longer than teams expect because it is where the scope document meets reality. A screen that reads as one line in a requirements list turns out to need four states.

Phase 3: Technical Architecture, 1 to 3 Weeks

Architecture produces the stack decision, the data model, and a map of every third-party integration the app depends on. On most projects it overlaps with design.

This is the shortest phase of the seven and the one most likely to be invisible on a project plan. It is also where an unexamined integration turns into a six-week problem later.

Phase 4: Development, 10 to 18 Weeks

Development produces working front-end and back-end code against the approved designs. It absorbs roughly half the total schedule on a typical build.

This is the phase everyone watches and the phase least likely to be the actual problem. When a project runs late, the cause is usually an upstream decision nobody made.

My teams run this phase against a fixed scope with a change-request process attached, so a new requirement arrives with its timeline impact already priced into it.

Phase 5: Quality Assurance and Testing, 3 to 6 Weeks

Testing produces a defect log with severity ratings and a record of what was fixed. It covers functional testing, performance testing, security testing, and user acceptance testing, which means putting the build in front of real users and letting them try to break it.

Teams that run testing alongside development find issues while they are still small and isolated. Teams that batch testing at the end inherit a pile of interconnected defects with no clean fix sequence.

Phase 6: Launch and App Store Review, 1 to 2 Weeks

Launch produces an approved build live on the store. The work is store listing preparation, metadata, screenshots, compliance checks, and submission.

Apple states that 90 percent of submissions are reviewed in less than 24 hours. Treat that as a service average. A build can sit in the Waiting for Review queue before a reviewer opens it, and that queue time is invisible on your submission date.

Google publishes a wider window. Play Console Help states that processing can take a few hours or up to seven days, and longer in exceptional cases, and Google recommends planning a buffer of at least a week. That one line moves more launch dates than any coding delay I have seen.

Rejection restarts the clock, which is why this phase carries a one to two week window. Apple reports that over 40 percent of unresolved review issues relate to guideline 2.1, App Completeness, covering crashes, placeholder content, and incomplete information. All of those are catchable before you submit.

Phase 7: Post-Launch Support, Ongoing

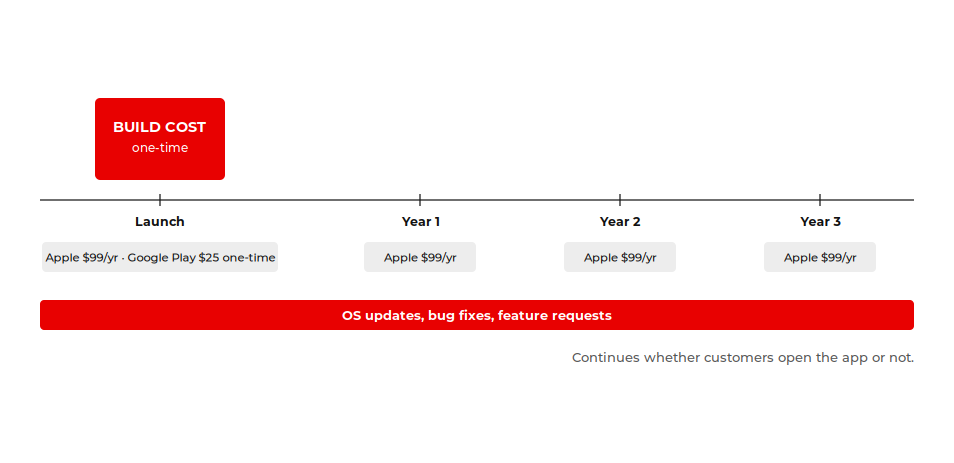
Post-launch support produces a monitored, patched, and iterating product. It has no end date, which is the reason it belongs on the plan.

Budget the first eight weeks after launch as active work. Real users find issues no test plan anticipated, and the fix window closes fast before store reviews harden.

The common failure here is treating launch as the finish line and releasing the team the week the app goes live.

How I Group the Phases, and Why the Count Varies

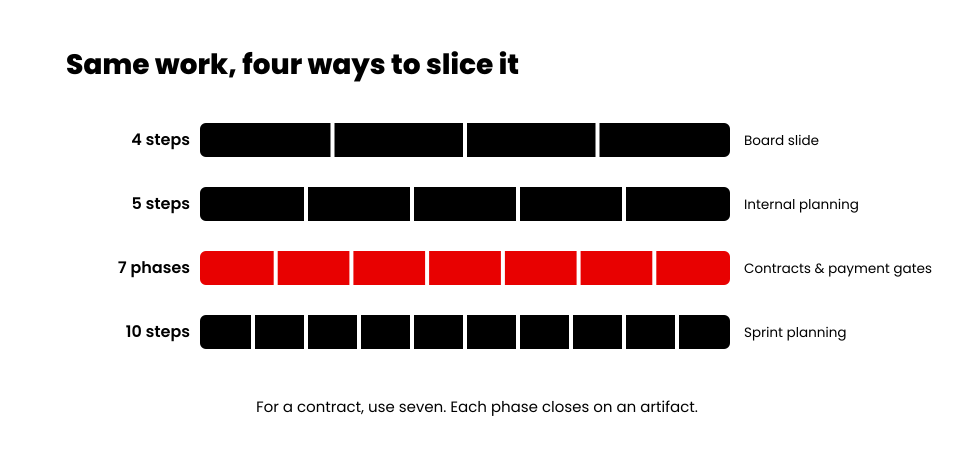
I use seven phases because each one produces an artifact you can point at, which makes it a defensible payment gate. Other groupings serve other purposes, and the count moves depending on where the lines get drawn.

Grouping What It Merges Where It Works
Four steps Define, design, develop, deploy. Requirements fold into define, testing folds into develop. Explaining the shape of a project to a board in one slide.
Five steps Testing separates from development. Architecture still folds into design. Internal planning where the stack is already settled.
Seven phases Discovery, architecture, testing, and post-launch each stand alone. Contracts and payment milestones. Each phase has a distinct artifact.
Ten steps Design splits into wireframing, prototyping, and visual design. Feasibility separates out. Sprint planning inside a delivery team.

Four ways to group app development phases into 4, 5, 7, or 10 steps, with seven fitting contracts best

Ten-step versions are usually labelled mobile app development lifecycle stages, which is part of why the number appears to move around. The work stays constant across all four groupings. Only the line placement changes.

For a contract, I would use the seven-phase model every time. Four steps are too coarse to hold anyone to, and ten create gates for steps that overlap in practice.

Where App Timelines Slip, and by How Much

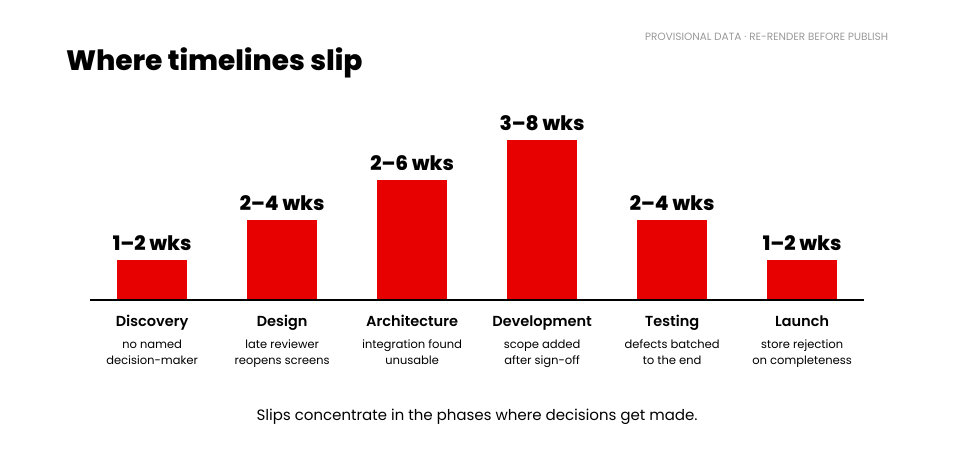
Timelines slip in four places, and three of them happen before any code is written. The table shows the pattern I see most often.

Phase Typical Slip What Causes It Earliest Warning Sign
Discovery 1 to 2 weeks No single decision-maker named Scope document in review for more than five days
Design 2 to 4 weeks Late reviewer reopens approved screens An executive joins a design call for the first time in week four
Architecture 2 to 6 weeks Integration discovered to be unusable A third-party API described as “we will confirm later”
Development 3 to 8 weeks Scope added after design sign-off Change requests arriving without timeline impact attached
Testing 2 to 4 weeks Defects found late because testing was batched First defect log appears after week two of development
Launch 1 to 2 weeks Store rejection on completeness Submission built with placeholder content

Typical schedule slip by app development phase, peaking at three to eight weeks when scope is added mid-development

The pattern is consistent. Slips concentrate in the phases where decisions get made. A project running late in development is usually paying for a decision that was avoided in week three.

Which Phases Compress and Which Have a Floor

Some phases genuinely shorten under pressure. Others have a floor, and pushing against it relocates the cost somewhere less visible.

Phases that compress:

  •     Development. Adding engineers works once the architecture is settled and the scope is fixed. It fails mid-design.
  •     Design. Reducing the number of scoped screens shortens this phase honestly. Reducing review rounds only defers the feedback.
  •     Discovery. Compresses when a decision-maker is available daily, and only then.

Phases with a floor:

  •     App store review. Speed here is not purchasable. Google recommends a week of buffer regardless of budget.
  •     User acceptance testing. Real users need calendar time to use the product before they can report on it.
  •     Security and compliance review. Regulated builds add fixed weeks that cannot be parallelized.

The honest way to shorten a timeline is to cut scope. Building a smaller version one and shipping it earlier is the mechanism that actually works. That is the premise behind MVP development, which means launching the smallest version of the product that still delivers the core value, and it is the one compression method that leaves no debt behind.

The Phase Exit Test: How to Audit Progress Without Reading Code

Check for artifacts. A phase reported as 90 percent complete tells you nothing. A phase that has produced its artifact is finished, and the number in the status report is a separate question.

Run this test at every gate in your mobile app development project timeline:

  •     Discovery is finished when a scope document exists and the sponsor has signed it.
  •     Design is finished when a clickable prototype exists covering every screen in that scope document.
  •     Architecture is finished when a written integration map exists naming every external system and its access method.
  •     Development is finished when a build runs on your own phone and matches the prototype.
  •     Testing is finished when a defect log exists with every critical and high-severity item closed.
  •     Launch is finished when the app is live and downloadable by someone outside the project team.
  •     Post-launch runs on a review cadence and has no exit gate at all.
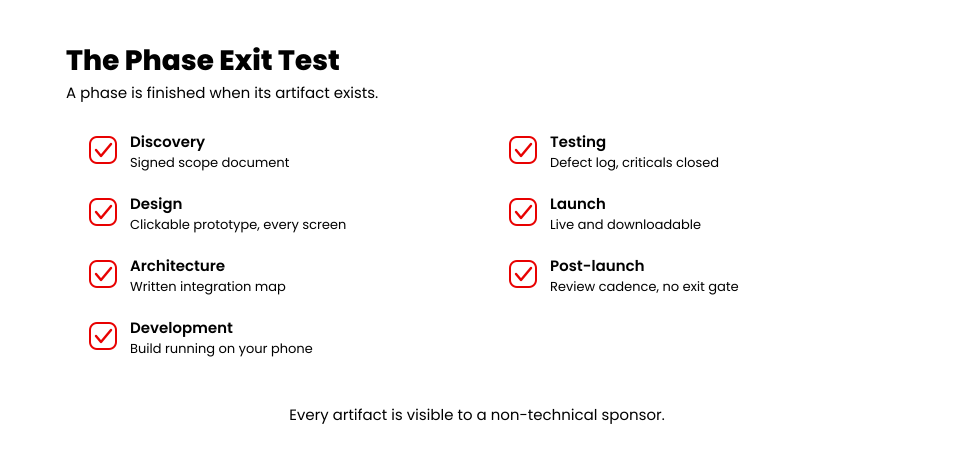
Phase Exit Test checklist matching each app development phase to the artifact that proves it finished

Every artifact on that list is something a non-technical sponsor can see. You do not need to read code to run this test.

The earliest reliable signal that a build is slipping is a status update that describes activity where a deliverable should be. When a report says the team is working through design feedback in week five and no updated prototype exists, the phase has not moved. That gap shows up two to three weeks before the date does.

See what cutting scope actually saves you

Adjust the feature set, platforms, and complexity, and get a cost range back for the version you would ship first.

→ Run the app development cost calculator

What Seven Phases Looked Like on the Spruce Rebuild

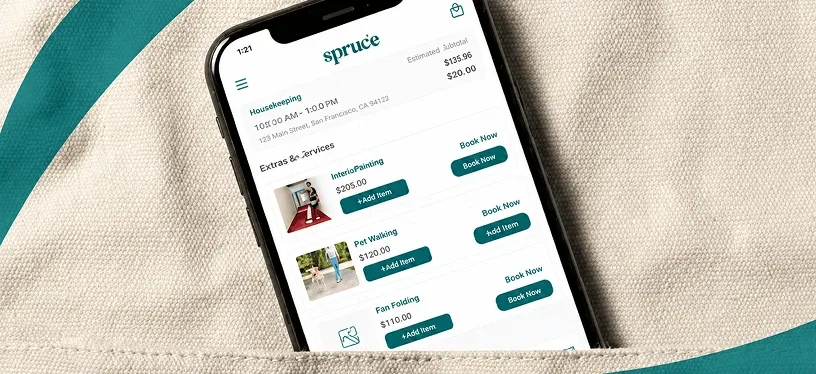
Spruce is a US property services platform. Residents, property managers, and short-term rental operators book cleaning and chore work through it, and vetted professionals deliver the jobs.

When the Spruce team came to us, they already had a working system. A resident mobile app, web portals for admins, service providers, and property managers, all of it running on a fragmented legacy architecture that made every feature update harder than the last.

The brief sounded like a redesign. Discovery turned it into something else.

Four things surfaced in that phase that were not in the original request. Service Pros had no mobile app at all, so jobs were being coordinated through people rather than software. The property manager portal was missing the property-level data managers needed to make decisions.

There was no capacity management, so the platform was overbooking providers. And pricing did not adjust for market, floor plan, or square footage, which left billing inconsistent across regions.

Each of those is a subsystem. On a project plan, “custom pricing configurator” occupies one line. In the build it became a module with its own rules, its own admin interface, and its own effect on every booking in the system.

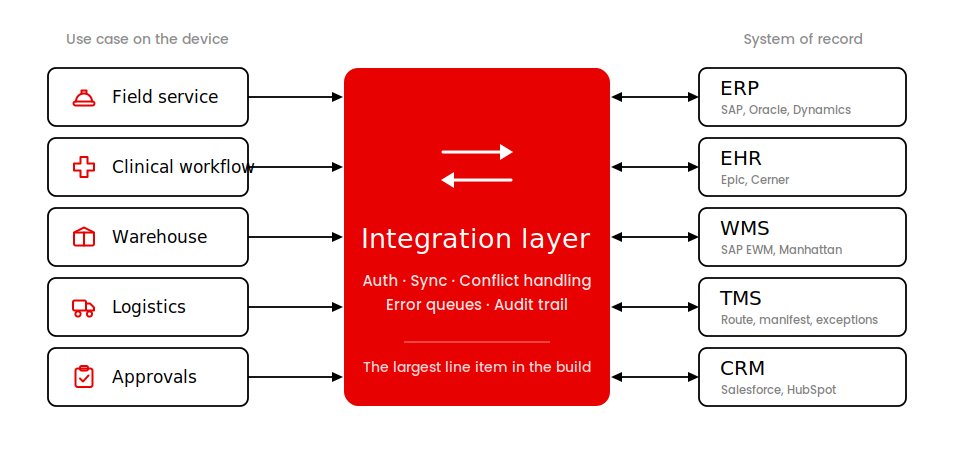
Architecture ran long on this project, and it earned the time. We were connecting Braze, Braintree, Slack, Front chat, and Mixpanel into one platform across five distinct user roles, on AWS with React, React Native, Node, Postgres, and Firebase underneath.

Mapping those integrations before development started is the reason development never stopped halfway through to renegotiate them. Thirteen modules shipped in the end, from authentication and role-based access through to capacity management, pricing configuration, and properties prospecting.

The platform now runs more than 6,477 properties and 685,000 customers, supported by 67 service providers and 7,581 property management companies. Published figures put it at a 25 percent reduction in service delays and a 30 percent increase in booking efficiency.

Here is the part that matters for your own plan. None of those four discoveries were visible in the original brief. They surfaced in discovery and architecture, the two shortest phases on the chart, and they set the length of everything that came after.
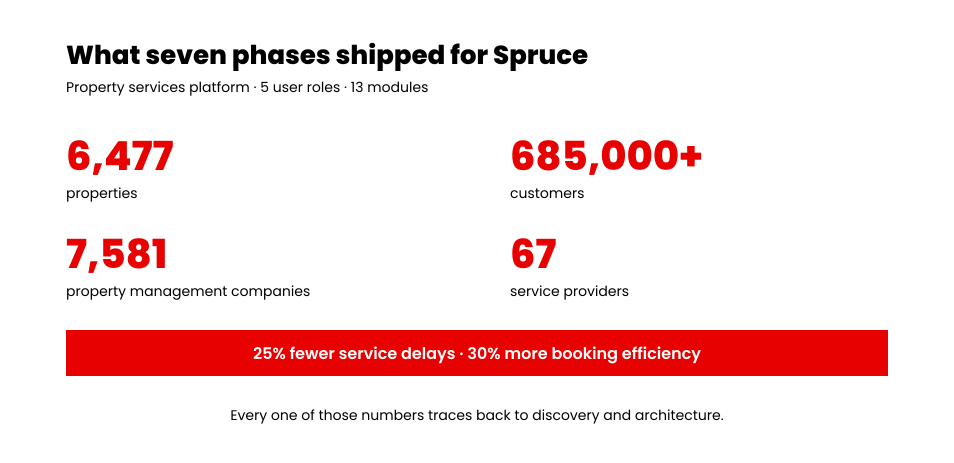
Spruce rebuild results: 6,477 properties, 685,000 customers, 25 percent fewer delays, 30 percent more booking efficiency

How Phase Durations Shift by Complexity and Platform

Complexity and platform choice change the length of the development phase far more than they change the others. Discovery, design, and launch stay broadly stable across project sizes, so the overall app development timeline moves mostly on build effort.

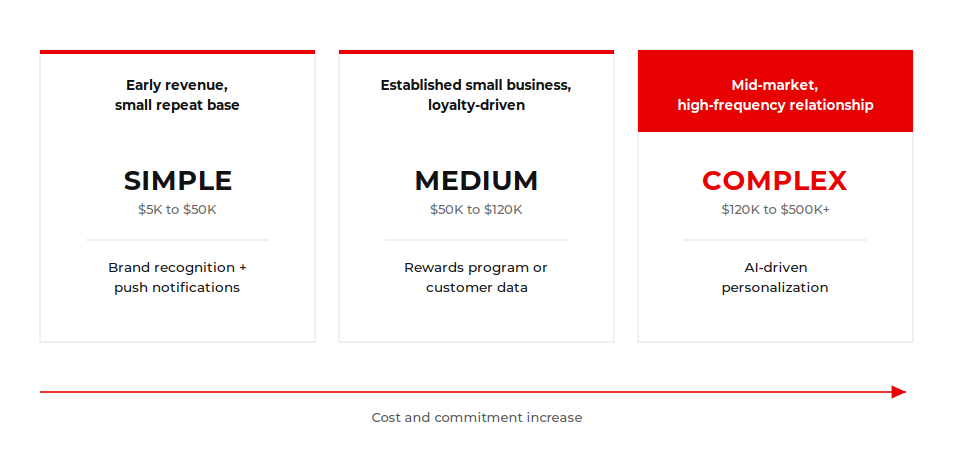
A simple app runs one to three months in total. A mid-complexity build runs four to seven months. A complex or compliance-heavy build runs eight months or more. For what each tier includes and costs, see our guide to app development cost in 2026, or run the numbers yourself with the app cost calculator.

Platform choice affects the development phase specifically. Two separate native builds add roughly 30 to 50 percent over a single platform, because discovery, design, architecture, and testing are largely shared. A cross-platform development approach shares one codebase and lands closer to a single-platform schedule, with platform-specific testing still required for both.

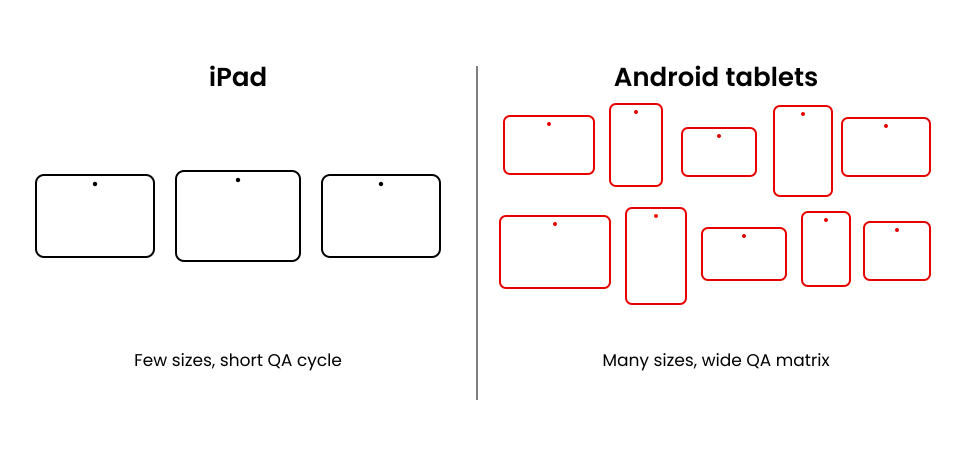
An iPhone app development schedule and an Android one run to similar lengths on their own. The difference shows up in review and device testing. Teams planning a mobile app development timeline for both platforms should budget the extra weeks in testing.

Regulated builds in healthcare, finance, or children’s categories add four to eight weeks that cannot be parallelized. Compliance documentation, audit logging, and external review run on their own schedule.

Final Thoughts

A phase plan with dates on it is a forecast. What makes it trustworthy is whether each phase produced the thing that proves it finished.

Take the duration ranges above into your next status call. Ask for the artifact behind each completed phase.

A partner running a disciplined process hands it over without hesitating. That is the whole test.

Explore our mobile app development services

We take iOS, Android, and cross-platform builds through all seven phases with a fixed scope, a named deliverable at every gate, and a change-request process attached. 

→ Build with a team that runs every phase to an artifact

Want the number before the plan? Run your build through the app development cost calculator and get a range in a few minutes.

How Long Does It Take to Build an App? Timelines by Type

How long does it take to develop an app? Most business apps take 3 to 9 months from kickoff to store approval. A simple single-function app ships in 2 to 4 months. A medium app with accounts, payments, and an admin panel takes 4 to 7 months. Enterprise and regulated builds run 9 to 18 months or longer.

Those ranges are the easy part. The harder question is what each month costs you. Build time consumes runway, delays revenue, and pushes your next board update. Compliance work under HIPAA or PCI DSS adds weeks that no feature list shows. App Store and Google Play review add days more at the very end. Scope changes after design sign-off are the single largest cause of slip.

This guide sets out timelines by app type and phase. It also covers what each month of build time costs, and why launch dates move.

Why this matters now: Google Play advises developers to build in a buffer of at least one week between submission and go-live. Reviews run from a few hours to seven days.

Every month you add to a build is a month you subtract from your runway.

Key Takeaways

  • Plan for the Full Development Timeline:
    Most business apps take around 3 to 9 months from kickoff through app store approval, while complex or regulated products can take 9 to 18 months.
  • Match Timeline to App Complexity:
    Simple applications can often launch within 2 to 4 months, while medium-complexity builds typically require 4 to 7 months depending on scope and integrations.
  • Development Drives the Schedule:
    Development generally accounts for 45% to 55% of the total timeline, making realistic technical planning essential for protecting both launch dates and business runway.
  • Understand Why Estimates Differ:
    Published development timelines often disagree because they measure different project scopes, feature sets, platforms, and levels of complexity.
  • Control Scope After Design:
    Changes introduced after design sign-off can create significant delays, while cross-platform frameworks may reduce overall build effort by roughly 20% to 40%.
  • Track Delays With a Slip Ledger:
    Use a Slip Ledger to identify whether schedule slippage comes from client-controlled decisions, vendor-controlled execution, or external dependencies so corrective action can happen quickly.

How Long Does It Take to Develop an App? The Short Answer

How long does it take to build an app depends on four scope tiers. Most business apps land in the 3 to 9 month band. The table below is the fastest way to place your own project.

App Type Typical Timeline What It Includes Example
Simple 2 to 4 months One core function, no backend, no accounts Calculator, event schedule viewer
Medium 4 to 7 months User accounts, payments, admin panel, APIs Booking app, fitness tracker, storefront
Complex 7 to 12 months Real-time features, multi-role access, deep integrations Marketplace, logistics platform, social network
Regulated 9 to 18 months HIPAA, PCI DSS or SOC 2 scope, audit trails, formal sign-off Telehealth platform, banking app

I use this table in every scoping call. Find the row that matches what you need at launch. Ignore the row that matches what you want in year two.

Add a discovery phase before the build starts. Skipping it moves the work later, when every change touches code that already exists.

App Development Timeline by Complexity: Simple, Medium and Complex

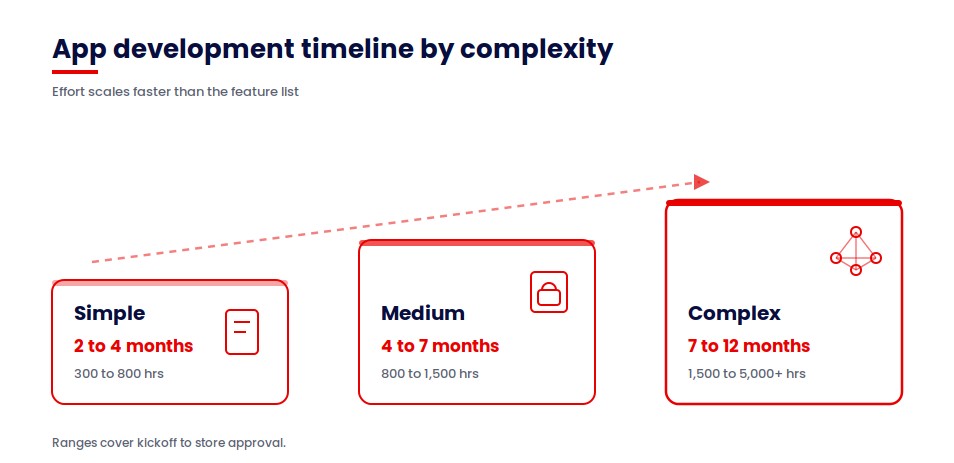
Complexity drives the app development timeline more than any other factor. Engineering hours scale faster than feature counts do. Here is what each tier costs in effort.

Complexity Tier Timeline Engineering Hours What Pushes a Project Into This Tier
Simple 2 to 4 months 300 to 800 Under 10 screens, no server, no login
Medium 4 to 7 months 800 to 1,500 Authentication, payment gateway, third-party APIs
Complex 7 to 12 months 1,500 to 5,000+ Live data, multiple user roles, scaled backend

(Alt text: App development timeline by complexity showing simple, medium and complex tiers from 2 to 12 months)

The mobile app development timeline follows these same three bands on iOS and Android. Platform choice shifts the effort, and the tier still sets the calendar.

Where most business apps actually land

Most of the projects I scope land in the medium tier. Founders arrive expecting the simple tier. The gap opens the moment a login screen enters the scope. One user account brings authentication, storage, recovery, and privacy handling with it. Our mobile app development team sizes projects against that reality rather than the feature list.

Why published estimates disagree

Public estimates for a simple app run from 2 months to 9 months. That spread is real, and it has one explanation. Each estimate measures a different scope. Some count only the build phase. Others count discovery, design, review, and launch prep. Some describe a prototype. Others describe a production release with monitoring in place.

Ask any estimate two questions before you trust it. Does the clock start at kickoff or at the first line of code? Does it stop at code complete or at store approval? Those two answers explain most of the variance you will find.

How Long Each Stage Takes

A full timeline for app development breaks into seven stages. Development is the longest by a wide margin. The rest are shorter than founders expect.

The durations below are for a medium-tier build on one platform. Scale them against your own tier using the table above.

Stage Duration Share of Schedule What Decides the Length
Discovery and requirements 2 to 4 weeks 8 to 12 percent Stakeholder availability and decision speed
UI and UX design 3 to 5 weeks 12 to 18 percent Number of screens and review cycles
Technical architecture 1 to 3 weeks 5 to 8 percent Integration count and environment provisioning
Development 10 to 18 weeks 45 to 55 percent Integration count and backend complexity
QA and testing 3 to 6 weeks 12 to 18 percent Device matrix and regression scope
Launch and store review 1 to 2 weeks 4 to 6 percent Store queues and submission completeness
Post-launch support Ongoing Not applicable Release cadence and defect volume

Read the stages individually. Architecture overlaps design on most projects, and QA runs alongside development, so the individual ranges sum higher than the calendar total they sit inside.

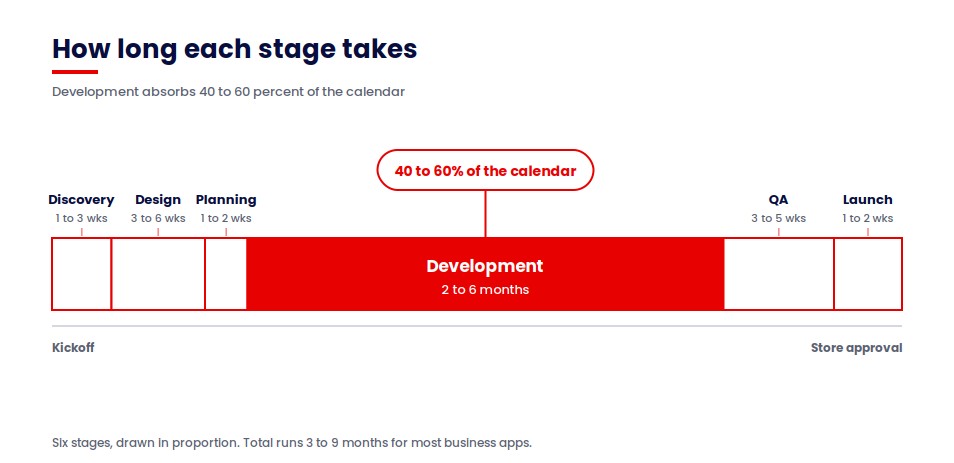
Development absorbs 45 to 55 percent of the calendar. Total app development time runs 3 to 9 months across these seven stages, depending on tier. For the wider process behind them, read our guide to the mobile app development process. A dedicated breakdown of app development phases covers each stage in depth.

(Alt text: Mobile app development timeline across six stages with development at 40 to 60 percent of the schedule)

Development absorbs 40 to 60 percent of the calendar. Total app development time runs 3 to 9 months across these six stages. For the wider process behind them, read our guide to the mobile app development process. A dedicated breakdown of app development phases covers each stage in depth.

How Long Does It Take to Build an MVP?

An MVP takes 3 to 5 months for the core build. Add 3 to 7 weeks for testing and release prep. How long does it take to build an app prototype? A single-function version with no backend takes 3 to 4 weeks.

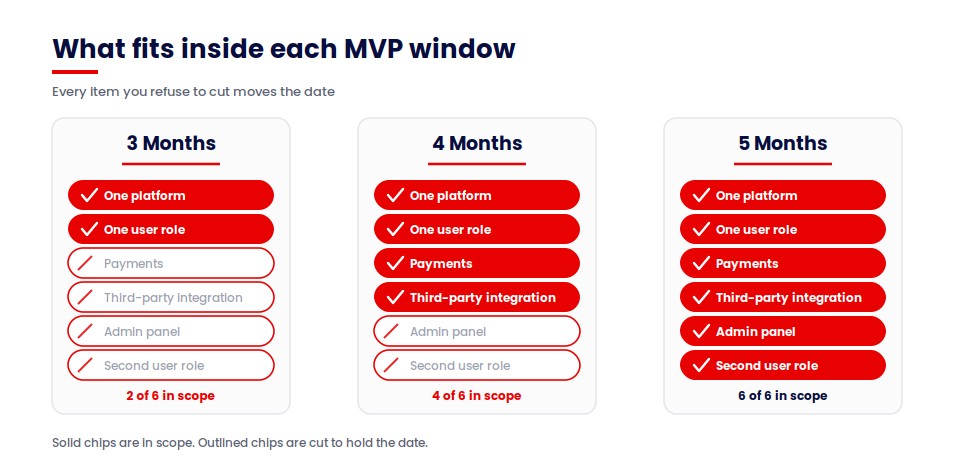
The window you hit depends on what you agree to cut. I put these trade-offs in writing before kickoff, because how long to build an app is decided at scoping rather than in the sprint.

  • To hit 3 months: one platform, one user role, no admin panel, no payments.
  • To hit 4 months: add payments or one third-party integration and keep the rest fixed.
  • To hit 5 months: add an admin panel and a second user role.
  • Beyond 5 months you are building a V1, and the scope conversation changes.

(Alt text: MVP scope comparison showing how long it takes to build an app prototype across 3, 4 and 5 month windows)

Every item you refuse to cut moves the date. Our MVP development engagements start by naming the one problem the first release solves.

iOS, Android or Cross-Platform: Does the Platform Change the Timeline?

Platform choice moves the schedule less than scope does. The answer to how long does it take to build an ios app sits close to the Android answer. A simple build takes 1 to 3 months on either platform.

Approach Added Effort Review Window Suited To
Native iOS only Baseline 90 percent under 24 hours Premium audiences, deep device features
Native Android only Baseline plus fragmentation testing A few hours to 7 days Broad reach, wide device range
Both natively Close to double the build effort Both queues apply Performance-critical products
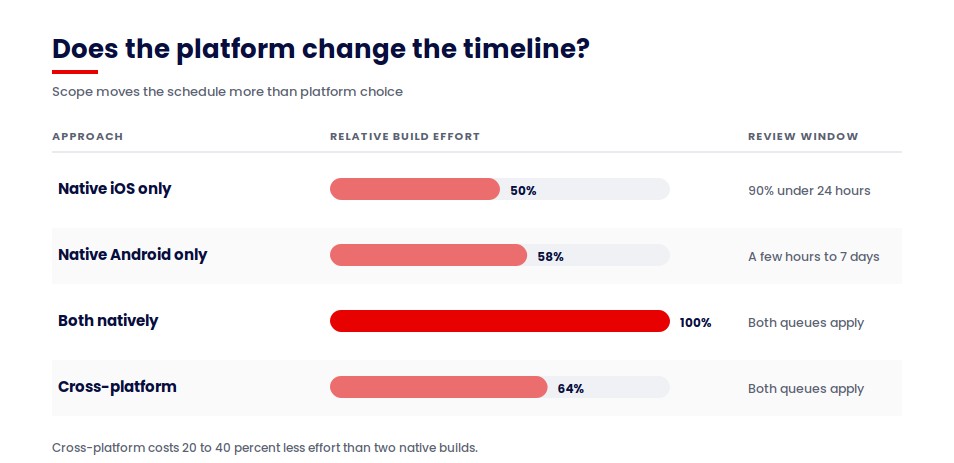
Cross-platform 20 to 40 percent less than two native builds Both queues apply Standard interfaces, faster market entry

Apple states that 90 percent of submissions are reviewed in less than 24 hours. Google Play reviews run from a few hours to seven days, and Google advises a one-week buffer. Android adds calendar time in testing rather than in review. Screen sizes and OS versions multiply the device matrix.

(Alt text: How long it takes to build an iOS app versus an Android app, with build effort and store review windows)

How long does it take to develop an Android app? Android runs the same for 1 to 3 months at the simple tier. The extra time appears in device testing rather than in code.

For the iOS-specific decisions behind these numbers, see our iOS app development guide.

Timelines by Industry: Healthcare, Fintech, Logistics and Retail

How long does it take to develop a mobile app in a regulated sector? Longer than the same feature set in retail. Compliance and integration depth add months before a single screen changes. Here is what we see across our own delivery work.

Sector Typical Range What Adds the Time
Retail and ecommerce 3 to 6 months Payment integration, catalog scale, PCI DSS scope
Logistics 5 to 9 months Live tracking, offline handling, carrier integrations
Fintech 7 to 12 months KYC flows, PCI DSS scope, audit trails, penetration testing
Healthcare 6 to 12 months HIPAA scope, access controls, clinical workflow sign-off

How long does it take to create an app for healthcare specifically? Six to twelve months, because access controls and clinical sign-off sit on the critical path.

What Each Month of Build Time Actually Costs You

A month of build time costs you a month of team burn. That figure is the number your board will ask about. The bands below pair our published cost ranges with the timelines above.

How long does it take to make an app set your burn window. A longer schedule spends the same team rate across more months.

Tier Timeline Build Cost Band Implied Monthly Burn Runway Consumed
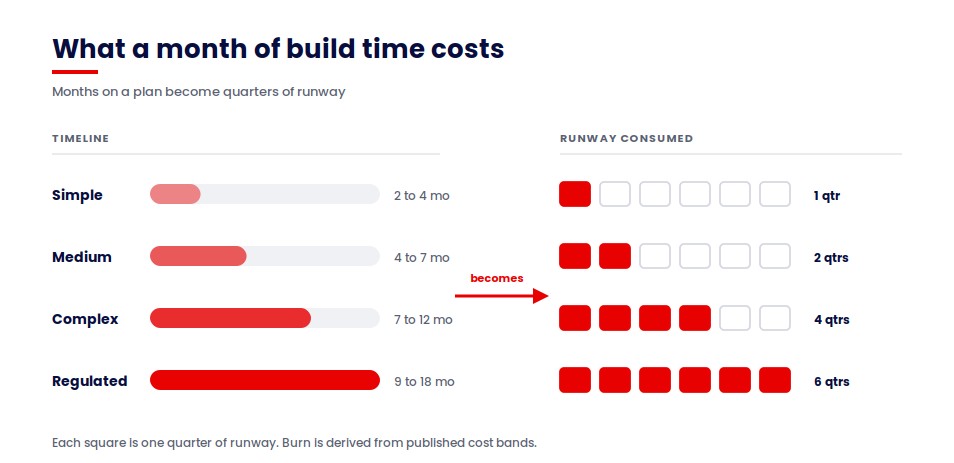
Simple 2 to 4 months From $20,000 $5,000 to $10,000 Under one quarter
Medium 4 to 7 months $40,000 to $120,000 $10,000 to $17,000 One to two quarters
Complex 7 to 12 months $120,000 to $200,000 $17,000 to $20,000 Two to four quarters
Regulated 9 to 18 months $200,000 and above $20,000 and above Three to six quarters

Cost bands come from our published mobile app development cost analysis. Monthly burn is derived by dividing each band across its timeline. Treat it as a planning figure rather than a quote.(Alt text: App development time converted into runway, showing four timeline tiers consuming one to six quarters)

Variance inside each band comes from three things. Integration count drives it first. Compliance scope drives it second. Approval latency on your side drives it third.

Not sure which tier your project sits in?

Answer a few questions about your scope and get a timeline and cost range built around your project.

→ Calculate Your App Cost

Why Compliance Scope Sets the Calendar: The CPCG Build

Collaborative Patient Care Group runs offshore support staff for US healthcare providers. Their representatives connect into unattended kiosks sitting in medical supply stores, scanning patient documents and operating software on machines with nobody standing in front of them.

When they came to us, that was running on a patchwork of general-purpose remote access tools. It worked, in the sense that connections happened. It also meant patient documents were moving through software nobody had scoped for healthcare access control.

The brief I received described a remote access product. What set the schedule was everything sitting underneath that.

We built four separate applications. A desktop app for the kiosks, a desktop app for the representatives, a web portal for client-side organization admins, and a super admin portal for CPCG themselves. Four applications means four sets of designs, four test cycles, and four release paths.

Then four role levels on top of that: representative, store manager, organization admin, and super admin. Every screen in the system had to answer what each of those four people could see and do. Role count multiplies design and QA work in a way feature count does not.

The requirement that surprised the client sat in the audit module. Super admins can silently join a live session for quality assurance, without notifying the representative or the kiosk. That is one line in a requirements document. In the build it touched session architecture, permissions, logging, and the entire QA plan, because you cannot ship a silent-observation feature without proving it behaves correctly in every access state.

Access control worked the same way. Representatives can only log in and out during predefined schedule hours, which turns a login screen into a scheduling system with enforcement behind it.

None of that appears on a feature list as extra time. All of it is a calendar. The platform runs on AWS with React, Electron, Node, React Native, and Postgres underneath, and it is now fully adopted across CPCG’s active stores and kiosks as the central platform for every representative interaction.

The lesson I take into scoping calls: in a regulated build, count the roles and the audit requirements before you count the screens. Those two numbers predict the schedule better than the feature list does.

Spruce shows the same principle without the compliance overhead. We rebuilt their US property-services platform across five distinct user roles, with a pricing engine and a capacity module underneath. Role count set that schedule too, and it landed in a shorter band because no audit regime sat on top of it.

On certifications, one clarification worth having before you scope a regulated build. AppVerticals is ISO 27001 certified, and our delivery practices are HIPAA-compliant, PCI DSS-secure, and SOC 2-aligned. That shortens preparation work. It does not remove the review cycles, so budget those as calendar time from day one.

Has AI Actually Made App Development Faster?

AI compresses the build stage and leaves the rest of the schedule intact. How long does it take to build an app with AI? Measure it at stage level. Project-level claims hide where the time actually sits.

Development is 45 to 55 percent of the calendar. A meaningful gain there still leaves half the schedule untouched. Claims of a 50 to 70 percent whole-project reduction come from vendors selling build tools. Their own product is the variable being measured.

What compresses

  • Boilerplate code and scaffolding.
  • First-draft test cases and synthetic data.
  • Documentation and release notes.

What does not compress

  • Discovery, because it runs at the speed of stakeholder availability.
  • Integration works against systems you do not control.
  • Compliance review and security sign-off.
  • Store review queues, which run on external timetables.
  • Code review, because a human still verifies every change.
Clients hear that AI writes the code and assume the project halves. On the projects I scope, the slow part sits elsewhere. It is deciding what to build and proving it is safe to ship.

The Slip Ledger: Why App Timelines Move, and Who Controls Each Cause

Timelines move for reasons that split cleanly into two columns. I built the Slip Ledger to make that split visible before a contract is signed. Read your own column first.

What the Client Controls What the Vendor Controls
Scope changes after design sign-off Estimation quality at proposal stage
Approval latency on designs and releases Integration planning and discovery depth
Access to internal systems, data and test accounts Staffing continuity across the build
Undecided or competing stakeholders QA sequencing rather than QA at the end
Late compliance or legal requirements Environment and release automation readiness

The largest item in the client column is scope change after design sign-off. The largest item in the vendor column is estimation quality at the proposal stage. Both are visible before kickoff, and both are negotiable.

Budget overruns follow the same pattern as schedule overruns. The Standish Group CHAOS Report has tracked this across decades of software projects.

What to do before you sign

  1. Name the single decision-maker for design approvals.
  2. Agree a change-control process with a stated timeline impact.
  3. Provide system access and test accounts before sprint one.
  4. Ask your vendor which assumptions carry the most schedule risk.

Conclusion

Your timeline is a budget decision before it is an engineering one. Pick the app type that matches what you actually need at launch. Then check that the range fits your runway and your roadmap. If the two do not line up, cut scope before you cut quality. A tighter MVP shipped in four months beats a full build abandoned at month ten. When you are ready to put numbers against the schedule, read our guide to mobile app development cost.

Put a budget against the schedule

Every month on this page carries a cost. See what each phase actually spends, line by line.

→ Read the app development cost breakdown

Keep reading: the mobile app development process, for the full build process these timelines sit inside.

How Much Does It Cost to Design an App in 2026? A Complete Breakdown

A full design engagement, covering research, wireframes, UI screens, prototyping, and testing, can run anywhere from about $3,000 for a simple app with a small screen count to $50,000 or more for a complex product built across multiple platforms with deep user research and several rounds of testing. 

That range is wide because it blends work from freelance marketplaces, boutique studios, and full service app development companies, and each provider prices the same set of activities differently. App design cost is also a separate line item from app development cost. 

Design covers the research and visual work that defines how the app looks and behaves. Development is the engineering work that turns that design into a working product. The sections below break down what actually shapes the price, what designers charge, and how to build a realistic budget for your own project.

Key Takeaways:

  • App design cost in 2026 typically ranges from $3,000 to $50,000+, depending on complexity, platforms, research, and testing requirements.
  • App design is a separate cost from development and covers UX research, wireframes, UI screens, prototypes, and design specifications.
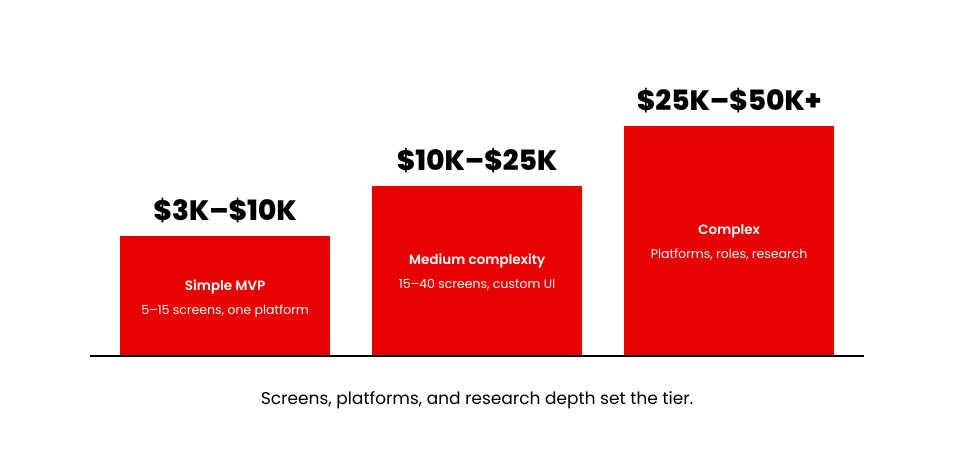
  • Simple MVP designs may cost around $3,000–$10,000, medium-complexity apps $10,000–$25,000, and complex products $25,000–$50,000+.
  • Key factors affecting app design cost include screen count, user flows, app complexity, platform coverage, custom interactions, design systems, and revisions.
  • A complete app design process includes UX research, information architecture, wireframing, UI design, prototyping, usability testing, and developer handoff.
  • Most small-to-medium app design projects take around 2–4 weeks, while complex products may require 6–8+ weeks.

How Much Does It Cost to Design an App in 2026?

Published estimates for app design vary widely because providers cover different levels of work. Fiverr lists app design services from about $35 to $9,000, ranging from individual screen designs to more complete UI packages. At the higher end, providers that include design within a broader product development engagement quote substantially more. Appinventiv estimates $3,000 to $30,000, SolveIt starts at around $5,000 and can exceed $20,000 for larger projects, while Jotform places the range at $3,000 to $50,000 or more.

For most projects, a practical planning range is $3,000 to $50,000+. Simple MVPs with limited screens and straightforward user flows generally fall toward the lower end, while complex apps with multiple platforms, user roles, custom interfaces, design systems, and usability testing require a larger budget.

These figures cover app design, not the cost of building the app itself. Design typically includes UX research, information architecture, user flows, wireframes, UI design, prototyping, and design specifications. Development is a separate phase that turns those designs into a functioning product.

The wide pricing range is therefore less about a single market rate and more about what the project includes, how complex it is, and who you hire. The sections below break down the main factors that influence app design cost, what designers charge, how long the process takes, and how to estimate a realistic budget for your project. For broader context on the mobile app market, see our breakdown of global mobile app development market statistics.

App Complexity Typical Design Cost Typical Scope
Simple MVP 3,000–10,000 5–15 screens, basic flows, one platform
Medium complexity 10,000–25,000 15–40 screens, custom UI, prototype, testing
Complex 25,000–50,000+ Multiple platforms, roles, advanced UX, research, testing

App design cost tiers in 2026 rising from $3K–$10K simple MVPs to $50K+ complex multi-platform builds

The biggest cost drivers are the number and complexity of screens, the number of platforms being designed, custom interactions and animations, research and usability testing, accessibility requirements, and whether the project needs a reusable design system. A simple app with a handful of straightforward screens requires far less design work than a marketplace, fintech platform, healthcare application, or multi-role enterprise product with dozens of interconnected flows.

For budgeting purposes, 5,000–25,000 is a reasonable starting range for many small to mid-sized app design projects, while more complex products can move well beyond $50,000. The right budget depends less on the label of the app and more on the actual scope of the design work required.

Design Only Quotes vs. Bundled Design and Development Quotes

Part of the confusion around published cost ranges comes from mixing two different kinds of quotes. A design only quote covers research, wireframes, UI screens, and a prototype, and nothing else. A bundled quote from an app development company folds design into a larger price that also covers engineering, quality assurance, project management, and often a maintenance period after launch.

Both are legitimate ways to buy app design. A design only engagement gives you finished files that any development team can pick up. A bundled engagement keeps design and development under one roof, which can reduce miscommunication between the team that designed the screens and the team that builds them, though it usually costs more upfront because it covers more work. Knowing which type of quote you are looking at before comparing numbers prevents a lot of unnecessary sticker shock.

How Much Does Each App Design Stage Cost?

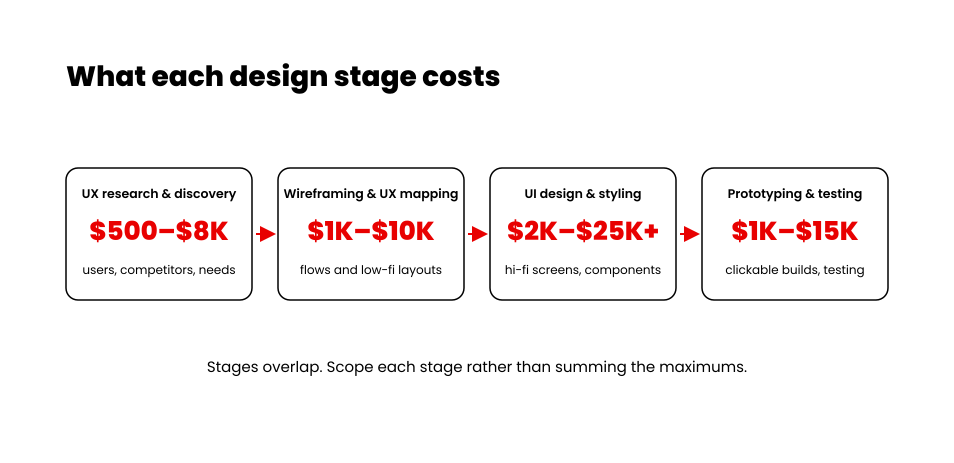
App design costs are spread across several stages, and each stage contributes differently to the final budget. Current 2026 estimates from Jotform put individual design stages in the following ranges:

Design Stage Typical Cost Range What It Covers
UX research and discovery 500–8,000 User research, competitor analysis, requirements, and product discovery
Wireframing and UX mapping 1,000–10,000 User flows, information architecture, and low-fidelity screen layouts
UI design and visual styling 2,000–25,000+ High-fidelity screens, typography, colours, components, and visual states
Prototyping and usability testing 1,000–15,000 Interactive prototypes, user testing, findings, and design iterations

Four app design stages with 2026 cost ranges: UX research, wireframing, UI design, and prototyping with testing


The stages can overlap, and not every project needs the same level of research or testing. A simple MVP may require lightweight discovery and a small prototype, while a complex product may need extensive research, dozens of screens, multiple prototype iterations, and structured usability testing.

The important point is that adding every stage at its maximum range does not automatically produce the right budget. Your actual app design cost depends on the scope of each stage, the number of screens and user flows, the platforms involved, and the team you hire.

What Does App Design Include?

A complete app design process defines how users move through the product, how information is presented, and how each interaction should work before development begins. Depending on the project’s scope, app design can include the following:

  • UX research: Designers study the target users, their needs, pain points, and the tasks they need to complete. This may involve user interviews, competitor analysis, surveys, or reviewing existing product data.
  • Information architecture: The content and features are organized into a structure that makes the app easy to navigate. Designers determine how screens, menus, categories, and other elements connect.
  • User flows: User flows map the steps required to complete important actions, such as creating an account, searching for a product, making a payment, or booking a service. Mapping these flows early can reveal usability problems before development starts.
  • Wireframes: Wireframes provide simplified layouts for individual screens. They focus on content placement, navigation, and functionality rather than colors, imagery, or detailed visual styling.
  • UI design: Designers create the visual interface, including typography, colors, buttons, icons, forms, cards, spacing, and other interface elements. The goal is to create a consistent visual language across the application.
  • Interactive prototype: A prototype connects the designed screens so stakeholders can experience key interactions before the app is built. Prototypes can also be used during usability testing to identify confusing or inefficient user flows.
  • Design system: Larger applications may require a reusable design system containing components, styles, spacing rules, typography, and interaction patterns. This helps maintain consistency as the product grows.
  • Usability and accessibility considerations: Designers evaluate whether users can understand and operate the interface efficiently. Depending on the project, this can include usability testing, responsive layouts, readable typography, sufficient contrast, and accessible interaction patterns.
  • Developer handoff: The final design package gives developers the specifications and assets needed to implement the interface. It can include screen designs, component states, measurements, design tokens, prototypes, and exportable assets.

Not every app requires the same level of design work. A small MVP may need basic user flows, wireframes, UI screens, and a prototype, while a large enterprise application may require extensive research, testing, accessibility work, and a complete design system. This difference in scope is one of the main reasons app design costs vary so widely from one project to another.

What Drives App Design Cost?

App design costs vary because the amount of design work required varies from project to project. A five screen MVP with a simple user flow requires far less effort than a fintech platform with multiple user roles, complex transactions, and dozens of interconnected screens. The main factors that influence app design cost include:

Number of Screens and User Flows

More screens generally mean more design work. However, the number of screens alone does not determine the price. A small app with complicated workflows can require more design effort than a larger app with straightforward navigation. Designers may need to create different states for each screen, including empty states, loading screens, error messages, confirmation screens, and permission prompts.

App Complexity

The features and interactions inside the app have a major impact on design effort. Basic features such as profiles, search, and simple forms are relatively straightforward. Features such as real time tracking, payments, scheduling, dashboards, chat, or multi step transactions require more detailed UX planning and interaction design. A multi role logistics platform, similar in structure to what we covered in our breakdown of building an app like Uber Freight, needs separate flows and screens for shippers, carriers, and administrators, and each of those flows needs its own research, design, and testing pass.

UX Research and Usability Testing

Research adds time and cost but can reduce the risk of building an interface based on assumptions. Depending on the project, designers may conduct user interviews, competitor research, usability tests, or prototype testing before finalizing the interface. A project that requires extensive research and multiple testing rounds will typically cost more than one that moves directly from requirements to UI design.

Platforms and Device Types

Designing for both iOS and Android can increase the scope because each platform has its own interface conventions and components. Platform coverage adds hours even when the visual style stays consistent. According to Clutch’s 2026 pricing data, app development companies charge roughly the same hourly rate regardless of operating system, but building for both iOS and Android usually means reviewing and adapting the design against each platform’s own interface guidelines. If you are also deciding how to build the app itself, your development framework choice, such as Flutter versus React Native, can affect how your design system needs to be structured for reuse across platforms.

Custom UI and Interactions

Using standard interface patterns can reduce design effort. Custom illustrations, animations, gestures, transitions, dashboards, and highly interactive components require additional planning and design work. For example, a basic checkout screen is relatively simple to design. A custom checkout experience with multiple payment methods, validation states, transaction status updates, and error handling requires considerably more UX and UI work.

Design System Requirements

A small MVP may only need a basic collection of reusable components. Larger products often need a complete design system covering typography, colors, buttons, forms, navigation, cards, spacing, component states, and interaction patterns. Building this system takes additional time upfront, but it can make future design and development more consistent and efficient.

Accessibility Requirements

Designing for accessibility can add requirements around color contrast, typography, touch targets, navigation, labels, and interaction states. The extent of this work depends on the product, target audience, platform, and applicable accessibility requirements.

Designer Location and Team Structure

Designer rates vary by location, experience, specialization, and engagement model. A freelance designer may charge differently from a specialized design agency or an in-house product team. The pricing model also matters. Designers may charge hourly, by project, or through a broader product design engagement. Comparing prices is therefore only useful when the included deliverables and scope are comparable.

Revisions and Scope Changes

The number of revision rounds can affect the final cost. Changes made after the user flows and interface have been approved can require additional work, particularly when they affect multiple screens or interconnected workflows. Defining the scope, deliverables, and revision process before design begins helps keep the project budget predictable.

How Much Do App Designers Charge?

App designer rates vary based on experience, location, project scope, and whether you hire a freelancer or an agency. In 2026, current marketplace and agency pricing data shows a wide range:

Hiring Option Typical Rate
Entry level freelance UI/UX designer $7–$25/hour
Mid level freelance designer $30–$75/hour
Senior or specialist designer $80–$125/hour
UX/UI design agency $25–$49/hour is the most common range on Clutch
UX/UI project on Clutch Typically $10,000–$49,999

Fiverr’s 2026 marketplace data puts professional UI/UX designer rates at 20–125 per hour, while its broader experience breakdown ranges from $7/hour for entry level designers to $125/hour for senior specialists. Fiverr also reports that mobile app UI design projects commonly cost 400–1,200 on its marketplace.

Agency pricing is higher for many full product design engagements because the scope can include UX research, strategy, wireframing, prototyping, usability testing, UI design, design systems, and developer handoff. Clutch reports that UX/UI projects listed on its platform typically cost 10,000–49,999, with most UX agencies charging 25–49 per hour.

Location also makes a significant difference. Clutch’s 2026 data lists typical UX/UI agency rates of 100–149/hour in the United States and Canada, compared with 25–49/hour in India, the Philippines, Ukraine, and Mexico.

The key point is that an hourly rate alone does not tell you what an app design project will cost. A designer charging $40 per hour but taking 150 hours could cost more than a designer charging $75 per hour who completes the same defined scope in 70 hours. When comparing quotes, look at the deliverables, number of screens, UX research, prototypes, revisions, design system, testing, and developer handoff included in the price.

How Long Does It Take to Design an App?

A typical app design project takes 2 to 4 weeks for the design phase. This generally covers defining user requirements, creating wireframes and mockups, refining the UI, and producing prototypes and development-ready design assets. Simple apps may take less time, while complex products can require several weeks or more.

A practical timeline looks like this:

Design Scope Typical Timeframe
Simple MVP 1–2 weeks
Medium complexity app 2–4 weeks
Complex app 4–8+ weeks

These ranges are estimates, Fiverr’s 2026 marketplace data, for example, estimates 2–4 weeks for a medium-complexity mobile app with around 10–15 screens, while complex UX projects can take 6–12 weeks when they include research, prototyping, usability testing, and detailed documentation.

Several factors can extend the timeline:

  • Number of screens: More screens and user flows require more wireframes, UI states, and revisions.
  • App complexity: Payments, real-time features, dashboards, multi-role workflows, and custom interactions require additional UX planning.
  • Research and testing: User interviews, usability testing, and multiple prototype iterations add time but can uncover usability problems before development.
  • Platforms: Designing for both iOS and Android can require additional platform-specific considerations.
  • Revisions: Frequent changes to approved user flows or screens can push the project beyond the original schedule.
  • Design systems: Building a reusable component library and detailed design documentation takes additional time, particularly for larger products.

It is also important to distinguish design time from total app development time. Clutch estimates the complete mobile app development process at roughly 20–40 weeks, with design accounting for about 2–4 weeks of that timeline.

For budgeting purposes, a 2–4 week design timeline is a reasonable starting point for many small and medium app projects, provided the requirements are clearly defined and feedback is delivered promptly. Larger applications with extensive UX research, multiple platforms, complex workflows, or usability testing should be planned on a longer schedule.

How to Estimate Your App Design Cost

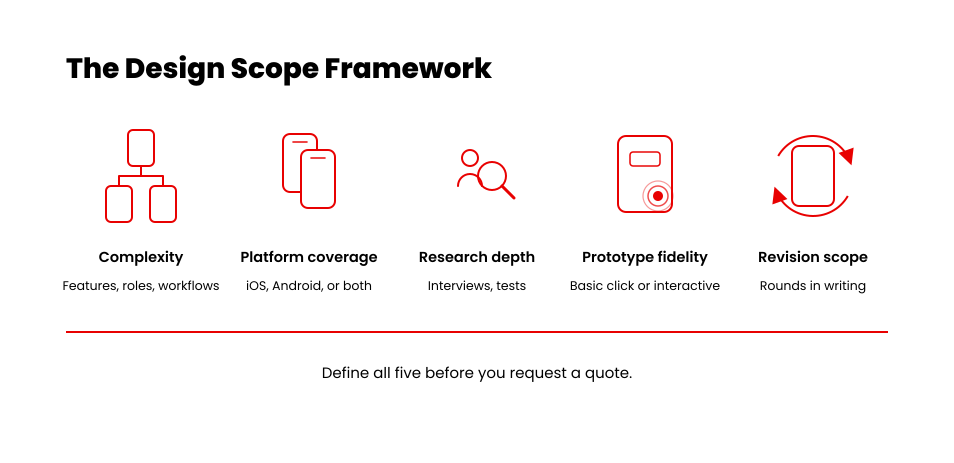
The AppVerticals Design Scope Framework gives you five variables to define before requesting an app design quote. Instead of starting with an arbitrary dollar figure, work through each variable to understand how much design work your project actually requires.

Cost Variable Questions to Answer How It Affects Your Budget
1. Complexity How many features, workflows, and user roles does the app have? More complex workflows require more UX planning, states, and testing.
2. Platform coverage Are you designing for iOS, Android, or both? Additional platforms require platform-specific review and adaptation.
3. Research depth Do you need interviews, competitor research, surveys, or usability testing? More research increases upfront design time but can reduce costly redesigns later.
4. Prototype fidelity Do you need a basic clickable prototype or a highly interactive prototype for testing? Higher-fidelity prototypes require more interaction design and iteration.
5. Revision scope How many formal revision rounds are included? More revisions increase the amount of design time and can push the project beyond its original scope.

AppVerticals Design Scope Framework: five variables that set app design cost before you request a quote

Start by defining the app’s features, screens, user roles, and core workflows. Then determine which platforms you need, how much research is necessary, how detailed the prototype should be, and how many revision rounds you expect.

For example, a moderate-complexity app with one platform, around 30 custom screens, a documented user flow, an interactive prototype, and one round of usability testing requires considerably more design work than a five-screen MVP with straightforward navigation.

Want a number before you talk to anyone? 

Run your feature list through the app development cost calculator to see where design sits inside your total build budget.

Calculate your app cost 

How to Reduce App Design Costs Without Sacrificing Quality

Reducing app design costs does not mean removing essential UX work or choosing the cheapest designer. The better approach is to control scope, validate decisions early, and reuse design components so your budget goes toward the parts of the product that matter most.

Start With a Focused MVP

Do not design every feature you may eventually want. Identify the core user journey and design the screens required to test and support it first. Fewer user flows mean fewer screens, states, prototypes, and revisions. This approach also makes it easier to validate assumptions before investing in a complete product. Nielsen Norman Group recommends using small usability tests rather than treating testing as a large, expensive research project.

Prioritize UX Before Visual Polish

A polished interface cannot compensate for a confusing user flow. Spend your early design budget on information architecture, user flows, wireframes, and prototype testing before investing heavily in visual details. Low fidelity prototypes can help teams test ideas before committing to high fidelity screens and production development. Recent research on MVP prototyping also supports low fidelity prototyping as a way to validate ideas with limited resources.

Use a Reusable Design System

Create reusable components for buttons, forms, navigation, cards, typography, colors, and other common interface elements. Once these components are defined, designers can build additional screens faster and maintain visual consistency. This is particularly valuable for larger apps because changes to a shared component can be reflected across multiple screens instead of requiring each screen to be redesigned independently.

Test Before Development

Fixing a usability problem in a prototype is generally less expensive than discovering it after developers have implemented the interface. Test the most important user flows before approving the final UI. You do not necessarily need a large research program. Nielsen Norman Group’s research recommends testing with five users for many usability studies and repeating small tests as needed.

Avoid Unnecessary Customization

Not every interface element needs to be designed from scratch. Standard platform patterns and established component libraries can reduce design effort when they fit the product. Custom interactions, illustrations, animations, and complex components should be reserved for areas where they provide meaningful value. The goal is not to make every screen unique, but to make the important parts work well.

Define the Scope Before Design Starts

Unclear requirements are a common source of additional design work. Before hiring a designer or agency, define the expected screens, user roles, platforms, core features, deliverables, revision rounds, and handoff requirements. A clear scope makes quotes easier to compare and reduces the risk of paying for repeated work caused by late changes.

Keep Designers and Developers Aligned

Involve development early enough to identify technical constraints before the UI is finalized. A design that looks simple but requires complex custom implementation can increase development costs later. A shared component library, clear specifications, and early developer feedback can reduce unnecessary redesigns and handoff problems.

The cheapest app design is not necessarily the one with the lowest initial quote. A better target is the lowest cost that still gives you enough research, UX validation, and design quality to make informed development decisions. Cutting useful validation may reduce the design invoice while increasing the cost of revisions later.

Final Thoughts

App design cost in 2026 can range from around $3,000 to $50,000 or more, but the right budget depends on what your app actually needs. Screen count, complexity, platforms, research, testing, custom interactions, and design system requirements can all change the final estimate.

The best way to control that cost is to define your core user flows, prioritize the MVP, validate the UX early, and agree on deliverables and revision rounds before design begins. A lower quote is not necessarily better if it leaves out the research, testing, or design work needed to build a usable product.

See What a Full App Design Engagement Actually Covers

Research, user flows, wireframes, UI screens, interactive prototypes, design systems, and developer-ready handoff, scoped to your screen count and platforms

Explore our UI/UX design services

Also Read: Mobile App development Cost in 2026 to better understand the breakdown. 

Types of Mobile Apps: Which One Fits Your Business

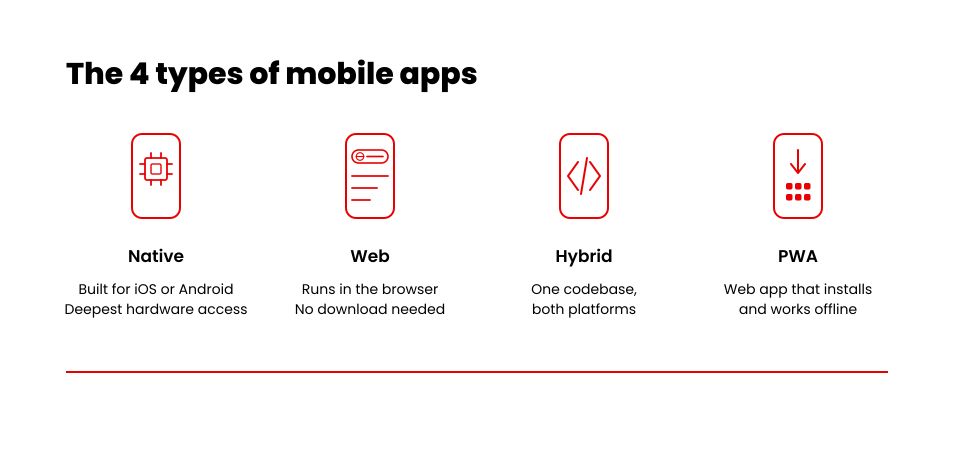
There are four types of mobile apps: native, web, hybrid, and progressive web apps (PWAs). The technology matters less than the business problem the app needs to solve, and the right choice depends on the users, their buying habits, and the available budget.

Clients often come to me asking for a native app because it sounds like the premium choice, before we have talked about whether the business actually needs one. This guide is the framework I walk them through: what each type is, what each one costs, and how to match the type to how you actually operate.

Global app revenue is projected to reach $739.61 billion in 2026, an 11.2 percent rise, according to Statista. That growth is why the fit question deserves real thought before any budget gets committed.

Your business model should pick the app type. The technology should never pick it for you.

Key Takeaways

  •     Four app types exist: native, web, hybrid, and progressive web apps.
  •     Business model should drive the choice, ahead of any technology preference.
  •     Cross-platform builds cost 30 to 40 percent less than dual native.
  •     We redesigned Spruce’s platform in React Native, and it now serves more than 685,000 customers.
  •     Native apps still win for heavy hardware use and app-store visibility.
  •     Web apps and PWAs skip app-store review and update instantly.
  •     Internal tools rarely need a full custom build.
  •     Use the Business-Model Selection Framework before you scope a build.

The Four Types of Mobile Apps, Explained Simply

Four types of mobile apps exist: native, web, hybrid, and progressive web apps. Each one trades cost, speed, and reach in a different way, and the type you pick sets the ceiling on all three before a single screen gets designed. The table below gives you the plain-language version of each.

App Type What It Is Where It Shines
Native Built specifically for iOS or Android and runs directly on the device Fastest load times and the deepest access to the camera, GPS, and sensors
Web Runs inside a mobile browser, so users do not need to download it Immediate reach and instant updates at the lowest cost
Hybrid One codebase shared across iOS and Android through React Native or Flutter A balance between native performance and cross-platform development cost
Progressive web app (PWA) A web app with offline access, home-screen installation, and push notifications App-like engagement without an app store listing

The four types of mobile apps: native, web, hybrid, and progressive web apps, each with its defining strength

Native, Web, Hybrid, or PWA: Strengths and Trade-offs

Dimension Native Web Hybrid PWA
Performance Fastest Browser-limited Near-native Browser-limited
Hardware access Deepest: camera, GPS, sensors Limited Broad, via frameworks Limited: basic camera, no Bluetooth
Offline use Full Minimal Full Partial
Distribution App Store and Google Play Any browser, no download App Store and Google Play Home screen, no store review
Codebases to maintain Two (iOS and Android) One One One

Each app type trades performance for cost in a different way. The right one depends on what your app needs to do, and for whom.

Native apps

Native apps run directly on iOS or Android. They give the fastest performance and the deepest access to a phone’s hardware, including the camera, GPS, and sensors. That strength comes at a price.

Building for both iOS and Android means two codebases, two test cycles, and double the long-term maintenance. Native suits apps where speed and hardware access decide customer trust. Banking apps and heavy AR use are good examples.

Web apps

Web apps run inside a mobile browser. Nobody has to download anything, so reach is immediate and update cycles are instant. The trade-off is limited offline access and no presence in the App Store or Google Play. Web apps suit internal tools and occasional-use products where app-store discovery does not matter.

Hybrid apps

Hybrid apps use React Native or Flutter to share one codebase across iOS and Android. Developers write the logic once and ship it on both platforms, which cuts build time and cost. Hybrid apps trade a small amount of native performance for a large reduction in build and maintenance cost. Our own build data backs this up, and the Spruce project below shows exactly how much.

Progressive web apps (PWAs)

A PWA adds offline access, home-screen installation, and push notifications to a web app. Users never visit an app store. Updates roll out the moment you publish them. A PWA fits businesses that want app-like engagement without app-store review delays or dual-codebase maintenance.

For a deeper technical comparison, see our full breakdown of native versus cross-platform development [link: https://www.appverticals.comnative-vs-cross-platform/]. Native, web, hybrid, and PWA each solve different problems for different budgets, which is exactly what the framework below maps out.

The Business-Model Selection Framework: Match Your App Type to How You Actually Operate

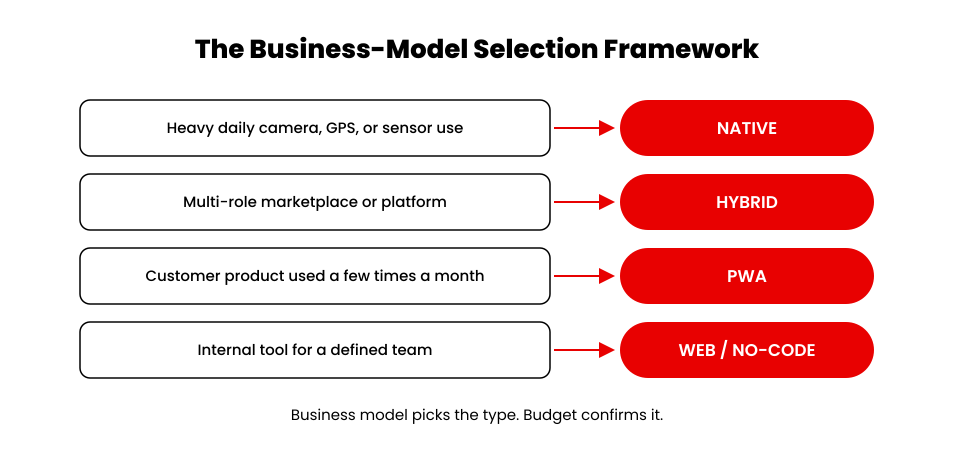
Business model decides app type more reliably than technical preference does. A consumer app, an internal tool, and a two-sided marketplace each pull toward a different answer, and that holds true regardless of which technology a founder personally likes.

Business-model selection framework mapping four operating models to native, hybrid, PWA, or web app choices

How You Operate App Type That Usually Fits Why
Consumer product with heavy daily use of the camera, GPS, or sensors (banking, AR) Native Speed and hardware access decide customer trust, and app-store visibility supports discovery
Two-sided marketplace or multi-role platform serving several user types Hybrid (React Native or Flutter) One codebase covers every role on iOS and Android and stays cheap to extend as roles grow
Customer product reached a few times a month; content or service business PWA App-like engagement, home-screen install, and instant updates without app-store review delays
Internal tool for a defined team Web app, or a no-code platform below the custom threshold Immediate reach in any browser, with no download and no store presence needed

Use this table as a starting point. A short scoping conversation still confirms the fit against your actual budget and timeline.

Not Sure Which Type Fits Your Business?

The framework above gets you close. A short scoping conversation gets you certain.

→ Talk Through Your App Type

How Spruce put the hybrid row into practice

Spruce is a proof point for the hybrid row above. The company runs a property services platform connecting residents, property managers, and service professionals across the United States.

Spruce came to us with a platform stretched past what its original architecture could support. Service professionals had no mobile app and coordinated jobs by phone and message. Property managers could see that bookings existed but could not see enough to manage their portfolios.

We redesigned the platform and shipped a mobile app for service professionals in React Native, on both iOS and Android from a single codebase. Cross-platform builds like this cost 30 to 40 percent less than building separate native apps, and React Native typically keeps 85 to 95 percent of native performance. Both are general benchmarks rather than measurements from this specific build.

The platform now supports more than 685,000 customers across 6,477 properties and 7,581 property management companies. That scale is exactly why the business-model lens mattered here. A multi-sided platform with several distinct user roles needed one codebase it could extend quickly, more than it needed the fastest possible frame rate on a single screen.

What Each Type of App Actually Costs to Build

App type sets the starting range for what a build costs. Complexity and integrations move the number further, but the type you choose decides the floor.

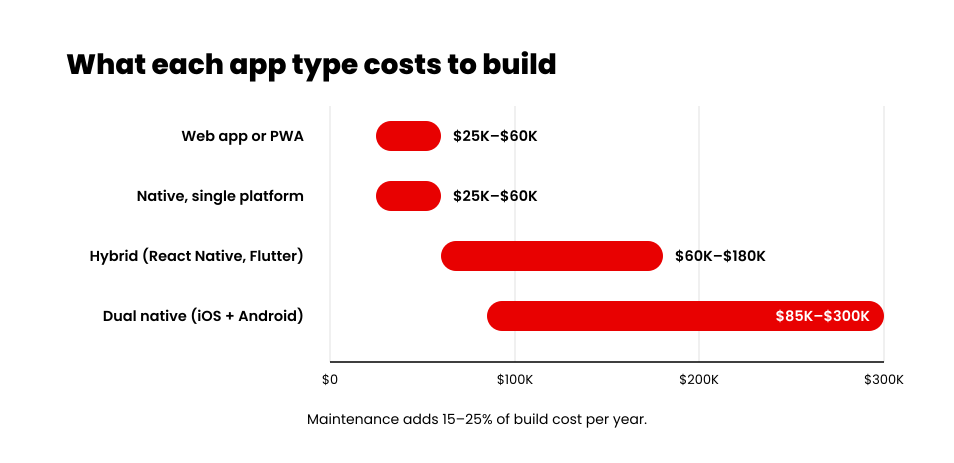
App Type Typical Range What Drives It
Native, single platform, simple scope $25,000 – $60,000 One codebase, one operating system, minimal backend
Native, iOS and Android built separately $85,000 – $300,000 Two codebases, two test cycles, double the maintenance
Hybrid or cross-platform (React Native, Flutter) $60,000 – $180,000 One shared codebase, cross-platform frameworks, standard integrations
Web app or PWA, simple scope $25,000 – $60,000 Browser-based, single codebase, no app-store review cycle

Cost ranges for the four types of mobile apps, from $25K web and PWA builds to $300K dual-native projects

Figures reflect our own project data in our 2026 app development cost breakdown. The dual-native range follows the same relationship quoted throughout this guide: a hybrid build runs 30 to 40 percent less than the equivalent pair of native apps. Actual cost still depends on integration count, compliance needs, and design depth.

Maintenance adds another 15 to 25 percent of the build cost every year, regardless of type. Budget for that before you commit to a number.

Do You Even Need a Custom App? When to Buy Instead of Build

Not every business needs a custom-built app. A short checklist below tells you whether you do.

App builders and no-code platforms have improved considerably. For a single internal workflow with a handful of users, one of them will get you running in weeks at a cost of a few thousand dollars. Paying for a custom build at that scale wastes your budget.

The calculation changes once you cross a real threshold:

  •     Three or more system integrations
  •     Compliance requirements such as HIPAA (the US health-data privacy law) or PCI-DSS (the payment card security standard)
  •     Real-time features at meaningful scale

When a client asks for a custom build to manage one internal process, the first question I ask is how many people will actually use it and what the team needs to get the job done. The platform that sounds impressive and the framework trending this year both come after that.

If your app needs custom integrations, or a roadmap beyond a single internal tool, loop in a team that scopes builds for a living. Our mobile app development team can help turn the right category into an actual build plan.

Mobile Apps by Function: A Quick Reference

Type and business model set the technical foundation. Function groups apps by what they do instead of by platform, and it is worth a quick pass before you finalize scope.

Function What It Covers Type It Usually Pairs With
Booking and on-demand services Scheduling, dispatch, and job coordination Hybrid, for multi-role coverage
Messaging and communication Chat, notifications, and status updates Native or hybrid, for reliable push
Payments and fintech Checkout, wallets, and billing Native, for hardware-level security
E-commerce and retail Catalogs, carts, and loyalty Hybrid or PWA, for reach plus engagement
Content and media Articles, video, and streaming PWA or web, for instant updates
Internal operations Approvals, reporting, and team workflows Web app, or no-code below the threshold

A single app can span more than one function. A resident-facing app might blend booking, messaging, and payments in one build. These functional categories often overlap inside a single scope, which is exactly the kind of conversation the framework above is built to guide.

Conclusion

You now have a framework that starts with how your business actually operates. Match your app type to how customers or employees use the product, then confirm the cost range against your budget before you scope a build.

The app type that fits a business is the one that matches that real usage and what the business can spend on building and keeping it running. Feature count comes after both. Once the type and the range line up, the next step is turning the category into an actual build plan.

Not Sure Which Type Fits Your Business?

The framework above gets you close. A short scoping conversation gets you certain.

→ Talk Through Your App Type

Keep reading: How Much Does It Cost to Make an App in 2026 for the full line-item breakdown behind the ranges above.

Wearable App Development: A Complete Guide for 2026

Wearable app development means building software for devices worn on the body: smartwatches, fitness bands, smart rings, and AR glasses. These apps power fitness tracking, remote patient monitoring, field operations, payments, and hands-free workflows, and they run on platforms like watchOS and Wear OS.

Most clients who bring me a wearable project arrive with a feature list and a hardware preference. I set both aside at first, because two earlier decisions, platform and data sensitivity, set the budget before any feature gets scoped. This guide follows that order: platforms, features, cost, enterprise use cases, compliance, and the technical constraints that shape all of them.

Grand View Research values the wearable technology market at $92.9 billion in 2025 and projects it to reach $229.9 billion by 2033. The demand side of this decision is settled. The engineering side is where budgets go wrong.

“Platform choice decides your wearable app budget more than any feature on your list.”

Key Takeaways

  •   Wearable app development covers smartwatches, fitness bands, smart rings, and AR glasses, built either standalone on the device or as a companion app synced to a phone.
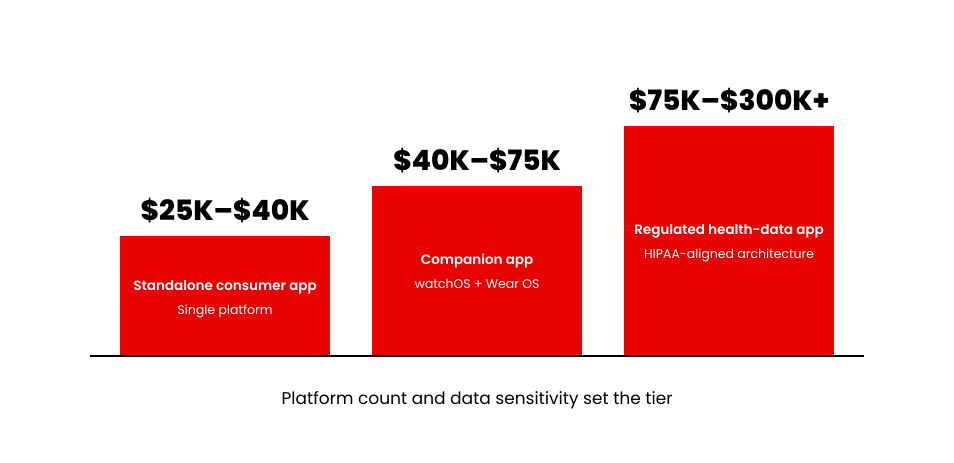
  •   Budgets run from $25,000–$40,000 for a single-platform consumer app to $75,000–$300,000+ once regulated health data enters the build. Platform count and data sensitivity set the tier; features move you within it.
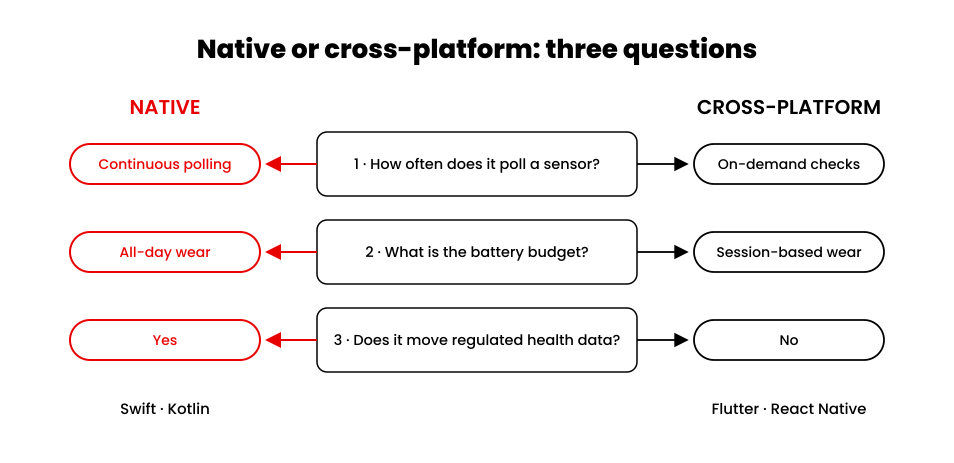
  •   Native code fits continuous sensor polling, all-day battery budgets, and regulated data. Cross-platform frameworks fit session-based apps that sync on demand.
  •  HIPAA compliance is an architecture decision designed in from the first sprint, and some health wearables also fall under the FDA’s Software as a Medical Device (SaMD) review.
  •  Battery life constrains every other engineering decision on a wearable. The core tradeoff is sensor polling frequency against power budget.
  •  Enterprise use concentrates in three jobs: remote patient monitoring, field-service dispatch, and warehouse safety alerts.

How a Wearable App Differs From a Mobile App

A wearable app runs directly on a small, battery-constrained device and gets used in glances rather than sessions. That single difference cascades into screen design, processing, and architecture.

Dimension Wearable App Mobile App
Screen size Small, glanceable Full screen, extended reading
Processing power Limited, often paired to a phone Full smartphone processor
Interaction model Glance, tap, voice, gesture Extended touch sessions
Architecture Standalone or companion synced to a phone Runs independently

A standalone wearable app runs without a phone nearby, managing its own connectivity and storage. A companion app depends on a paired phone for processing and long-term storage. I confirm which model fits a client’s use case before I recommend a platform, because the answer changes both the architecture and the budget tier.

Our wearable and IoT development team builds both models across every major wearable platform.

Types of Wearable Devices and the Platforms Behind Them

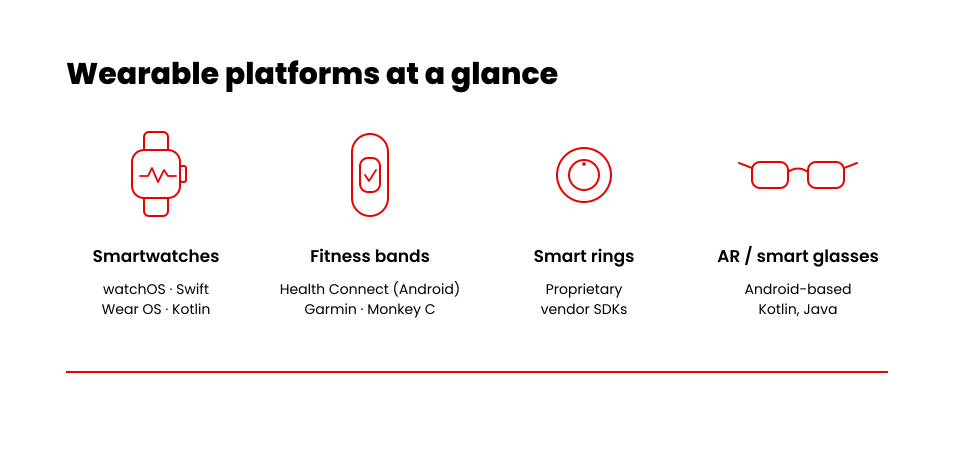
Four device categories cover almost every wearable project I scope: smartwatches, fitness bands, smart rings, and AR or smart glasses. Each one locks you into a different platform, language, and constraint set, which is why the device decision comes before the feature list.

Four wearable device types mapped to their platforms: watchOS, Wear OS, Health Connect, Garmin, vendor SDKs, and Android

Apple Watch runs watchOS, built with Swift, with health data flowing through Apple HealthKit. Most Android-based watches run Wear OS, built with Kotlin, while Samsung’s older Gear line ran on Tizen. If your users wear watches, this is a two-platform world for all practical purposes.

Fitness bands are mid-transition. Fitbit’s JavaScript-based device runtime is a legacy path now, and Google is consolidating Android health data into Health Connect, its unified on-device health API, while cloud integrations built on the old Fitbit Web API move to the new Google Health API before legacy endpoints shut down in September 2026. I point every new fitness-band client toward Health Connect rather than legacy Fitbit APIs. Garmin sits apart: its Connect IQ SDK uses Monkey C, a language Garmin built specifically for its own devices.

Smart rings still rely on proprietary vendor SDKs, since no open standard covers the category yet. AR and smart glasses mostly run Android-based platforms, built with Kotlin or Java. Rings, glasses, and bands each carry different limits on battery, memory, and connectivity, and those limits shape the feature set more than any roadmap does.

Core Features Every Wearable App Needs

Every wearable app I ship carries four features, regardless of platform. Miss one and the app gets abandoned within weeks.

  •    Real-time sync. The app must move sensor data to a phone or the cloud as it happens. Most wearables sync over Bluetooth Low Energy, a protocol built for small, battery-powered devices.
  •    Gesture or voice control. Small screens need hands-free input, so I build tap, swipe, and voice paths into every interface.
  •    Offline mode. A wearable loses connectivity often, and core functions have to keep working without a live connection.
  •    Security. Encryption and authentication protect the health and location data every sensor collects.

How Much Does Wearable App Development Cost in 2026?

Wearable app development cost depends more on platform count and data sensitivity than on any single feature. Those two variables set the tier, and the feature list moves you around within it. Here are the average ranges I quote clients, based on the projects our team has scoped.

Build Scope Platform Average Range What Drives the Variance
Standalone consumer app Single platform $25,000–$40,000 Sensor count and offline mode requirements
Companion app synced to a phone Dual platform, watchOS and Wear OS $40,000–$75,000 Bi-directional sync architecture and notification handling
Regulated health-data app HIPAA-aligned architecture $75,000–$300,000+ Continuous telemetry, audit logging, and FDA SaMD review scope

Three wearable app development cost tiers rising from $25K–$40K single platform to $75K–$300K+ for regulated health data

These are averages from our own project scoping, and they are a starting point rather than a substitute for a scoped quote on your specific build. A project can also move up a tier quickly once regulated health data enters the picture, because continuous telemetry, audit logging, and compliance review add scope that has nothing to do with the visible feature list.

Want a breakdown tailored to your exact features and platform scope?

Use our interactive estimation tool to calculate a project baseline in minutes.
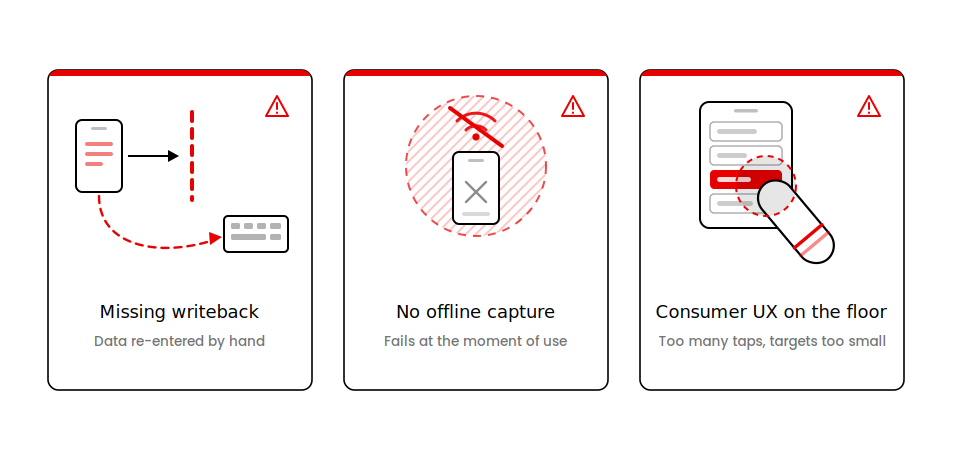
Get a fast estimate for your own scope →

Enterprise and Healthcare Wearable Use Cases

Enterprise and healthcare teams use wearable apps for three specific jobs: clinical remote monitoring, field-service dispatch, and warehouse safety alerts. Each one earns its budget by removing a phone from someone’s hands at the moment those hands are busy.

Healthcare wearable app development usually starts with remote patient monitoring, or RPM. A wearable sensor tracks vitals between clinic visits and flags anything abnormal to a care team, which keeps patients out of the office for routine checks. Our healthcare app development expertise extends the same remote-monitoring pattern into full care platforms such as Visionze.

Field-service teams use smartwatch apps for route guidance and hands-free checklists. A technician glances at a wrist instead of pulling out a phone mid-task, which keeps both hands on the actual repair or install.

Warehouse and logistics teams use wearables for safety alerts and hands-free scanning. A vibration or an on-screen alert warns a worker before a hazard becomes an incident, and hands stay free for the scanner or the pallet.

Native vs Cross-Platform: The Three Questions That Decide It

Three questions decide whether a wearable app should be native or cross-platform, and a personal preference for one toolkit should never be the deciding factor. I ask them in the same order on every scoping call.

Three-question framework choosing native or cross-platform for wearables: sensor polling, battery budget, regulated data

Question one: how often does the app poll a sensor? Continuous polling favors native code, since it sits closer to the hardware. On-demand or periodic checks run fine on a cross-platform framework such as Flutter or React Native.

Question two: what is the battery budget? All-day wear pushes toward native, because native code manages power more precisely. A session-based app, worn for a workout or a shift, has more room for a cross-platform build.

Question three: does the app move regulated health data off the device? Regulated data pushes toward native, since audit logging and encryption need tighter hardware control. An app with no regulated data can lean cross-platform without that constraint.

Regulatory and Compliance Considerations for Health-Data Wearables

HIPAA compliance for a wearable app is an architecture decision, planned into the system design before the first sprint. The HIPAA Security Rule requires encryption, access controls, and audit logging for any system handling protected health information, and a wearable app that reads heart rate, SpO2 (blood oxygen), or glucose data falls under it.

Some health-tracking wearables also qualify as Software as a Medical Device, or SaMD, under FDA guidance, which adds a regulatory review path on top of HIPAA. I check SaMD classification during the earliest scoping conversation with a client, because finding out later reprices the whole build.

Real vetting matters more than a stated commitment to best practices. Ask any wearable development partner four questions before you sign a contract:

  •     Which platform have they shipped on: watchOS, Wear OS, or a proprietary device SDK?
  •     Can they show FDA submission or HIPAA audit experience on a real project?
  •     Do they have a live, shipped wearable product, beyond a service listing?
  •     What encryption and access-control approach do they use for data at rest and in transit?

The Wearable App Development Process, Step by Step

Six steps take a wearable app from concept to launch, in the order I run them with every client.

  1.     Discovery. We confirm the use case, the target device, and whether the data is regulated.
  2.     Platform selection. We apply the three questions above to choose native or cross-platform.
  3.     UX for small screens. We design for a glance, with one primary action and minimal text per screen.
  4.     Build. Engineers integrate the sensors, connectivity, and the four core features covered earlier.
  5.     Test across devices. Every build gets tested on real hardware, in addition to a simulator.
  6.     Launch and maintain. Wearable operating systems update often, so maintenance stays part of the plan.

Common Challenges and How to Plan Around Them

Battery life limits every other decision on a wearable build, more than screen size or device compatibility. Continuous sensor polling drains a battery fast, so I trade data frequency against power budget deliberately, using the same battery question from the platform framework. An app that checks a sensor once a minute lasts far longer than one that streams constantly.

Screen-size constraints shape every design decision on a wearable interface. I limit each screen to one primary action and minimal text, and anything that needs a paragraph of explanation belongs on the paired phone app instead.

Multi-device compatibility adds real engineering time, because a companion app has to work across phone models, watch models, and operating system versions at once. I build the compatibility test matrix during discovery, before any code gets written.

What a Connected-Hardware Project Taught Us About Wearable Constraints

The clearest lesson our team has on these constraints came from hardware that sits on a shelf instead of a wrist. A UAE scent-marketing brand sells premium cold-air diffusion machines to hotels, spas, malls, and boutiques. The machines were excellent hardware operating as isolated units: no reliable phone communication, no smart scheduling, no way to manage several devices across a property.

Their team needed the same thing every wearable team needs: a stable, real-time link between a small device and a phone. Our engineers extended the companion app that connects to the diffusers over Bluetooth and Wi-Fi, adding smart timing schedules by day of the week, working-and-pausing intervals configured in seconds to control scent intensity, and a dashboard that groups devices by location.

Those interval controls are the exact duty-cycle tradeoff this guide keeps returning to: how often a device acts versus how much power and attention it burns. A diffuser meters fragrance, and a wearable meters sensor reads. Solving connectivity, scheduling, and multi-device management for one constrained device class builds the same engineering muscle the other one demands, which is why I treat every wearable scope as a connected-hardware problem first.

Conclusion

Wearable app development prices out as three separate decisions: platform, data sensitivity, and scope. Get those three right before you set a budget and the cost range stops being a guess. If your build touches health data, start with the compliance question, because it moves the tier more than any feature can. For a build plan scoped to your platform and data needs, our wearable and IoT team can run the same framework from this guide against your specific project.

Scope Your Wearable Build

Our wearable and IoT engineering team designs, builds, and ships regulated, enterprise-grade wearable software.

Talk to our wearable and IoT team→

Keep reading: Mobile App Development Cost for how the same platform and compliance factors play out across mobile builds.

Tablet App Development: Cost & Decision Guide 2026

Tablet app development becomes a real question the moment a phone-first app stops working for the people using it. A field technician squints at a five-inch screen while checking a wiring diagram. A nurse tries to chart on a phone between patient rooms. A retail associate rings up a sale on a device built for texting.

Each of those scenes turns “should we build a tablet app” into a support ticket. By the time it reaches me, someone has usually already bought the tablets.

This guide covers when a dedicated tablet build is worth the spend, what it costs against extending an existing phone app, and what changes operationally once a fleet of shared tablets enters the picture. Android’s tablet ecosystem is more fragmented than Apple’s, and that shapes both design choices and testing effort.

The answer I give most often is narrower than clients expect. Build a tablet app when the workflow demands the screen.

Key Takeaways

  •  Wearable app development covers smartwatches, fitness bands, smart rings, and AR glasses, built either standalone on the device or as a companion app synced to a phone.
  •  Budgets run from $25,000–$40,000 for a single-platform consumer app to $75,000–$300,000+ once regulated health data enters the build. Platform count and data sensitivity set the tier; features move you within it.
  •  Native code fits continuous sensor polling, all-day battery budgets, and regulated data. Cross-platform frameworks fit session-based apps that sync on demand.
  • HIPAA compliance is an architecture decision designed in from the first sprint, and some health wearables also fall under the FDA’s Software as a Medical Device (SaMD) review.
  • Battery life constrains every other engineering decision on a wearable. The core tradeoff is sensor polling frequency against power budget.
  • Enterprise use concentrates in three jobs: remote patient monitoring, field-service dispatch, and warehouse safety alerts.

What Counts as Tablet App Development (and How It Differs From a Phone Build)

Tablet app development means designing software specifically for a tablet’s larger screen and different interaction patterns. It is not a phone app stretched to fit. It covers layout, navigation, and features built around split-screen use, landscape orientation, and more on-screen content than a phone allows.

Apple and Google both publish official design rules for this. Apple’s guidelines cover designing for iPadOS directly. Android’s large-screen guidelines cover tablets, foldables, and Chromebooks together. Tablet application development also involves testing against a wider range of screen sizes than a phone app needs. A phone app resized to fit a tablet screen looks stretched. That gap is why businesses with tablet-heavy workflows commission a dedicated build instead of a resize.

When Your Business Actually Needs a Tablet App: Industry Use Cases

Your business needs a tablet app when a specific team’s workflow demands more screen space than a phone provides. Three roles show this pattern most often: field technicians, bedside clinicians, and retail staff running point-of-sale.

Field service

Field technicians reference wiring diagrams, schematics, and equipment manuals while working hands-on. A tablet shows more of that document at once. It also mounts more securely in a vehicle or on equipment than a phone does. Tablet app development services for field teams add offline access, since job sites rarely have reliable connectivity.

Clinical charting

Clinicians chart at the bedside, often on a shared device passed between shifts. A tablet gives enough screen space for a full electronic health record form. A phone screen forces constant scrolling through the same form. That scrolling adds time clinicians do not have.

Retail point of sale

Retail associates use tablets differently. Quick lookups and fast checkout favor portability over screen size. A small tablet with integrated payment hardware often beats both a phone and a full-size tablet for this specific task.

The Decision Matrix: Device, Use Case, and When to Build

Use this decision matrix before committing a budget to a tablet build. It maps a workflow signal to a device recommendation, with the reasoning behind each call.

Workflow Signal Device Recommendation Why
Field technician referencing diagrams or manuals while working hands-on Tablet Larger screen for schematics; mounts more securely in a vehicle or on equipment than a phone.
Clinician charting at bedside Tablet Screen real estate for EHR-style forms; a shared-device model across a care team.
Retail associate doing quick lookups or ringing up a sale on the floor Phone, or small tablet if payment hardware is integrated Portability and one-handed use matter more than screen size for fast, repeated interactions.
Warehouse picker scanning individual items Phone or wearable scanner Speed and one-handed use outweigh the benefit of a larger screen for this task.

Read the matrix by workflow. The same healthcare organization might need tablets for bedside charting and phones for a nurse doing rounds. Match the device to the task.

Need Help with Planning Your App?

Once you know whether a tablet makes sense for your workflow, our complete mobile app development guide walks through planning, design, development, testing, deployment, and cost.

→ Read the Mobile App Development Guide

Design and UX Differences Tablets Require

Tablet design differs from phone design in five ways. Screen size, multi-window support, orientation, number of users, and target audience all shift.

Screen size changes how much content fits on one view. A field technician’s diagram viewer can show a full schematic on a tablet. A phone forces panning and zooming instead. Multi-window and split-screen support let a clinician reference a chart while entering notes in a second pane. Orientation matters more on a tablet. Field and retail apps often default to landscape. 

Clinical charting apps often stay in portrait. A tablet is also more often a shared device than a phone is. A shift-based retail app needs a fast login and logout flow. That flow cannot carry over a single-user assumption from the phone build.

Android vs iOS Tablet Fragmentation: What to Plan For

Few uniform iPad screen sizes beside many varied Android tablet sizes, showing why Android widens the QA matrix

Android tablets carry more design and testing risk than iPads, mainly because Android hardware is far less standardized. Plan for that risk before you pick a platform.

iPad hardware ships in a small, predictable set of screen sizes, which makes iPad app development services easier to scope and test. Android tablets do not. Screen sizes, resolutions, and manufacturer skins vary widely across Android tablet app development projects. That variety multiplies the testing matrix. Custom iPad app development also benefits from that consistency, since fewer screen sizes means a shorter QA cycle. Android’s own SDK has historically lacked a dedicated tablet concept, unlike iOS. Google’s adaptive app quality guidelines now address this directly. Codebases built by an earlier Android tablet app development company may not follow them yet. I recommend budgeting extra QA time if your build targets Android tablets first. Windows Surface tablets are a smaller third option; most projects still concentrate on iPad and Android.

What It Costs to Build a Tablet App: Extend vs. Build From Scratch

A tablet build falls within the mobile app development range. That range runs from 40,000 to 400,000 dollars. It shares the same backend, compliance, and QA overhead as any custom app. The tablet-specific variable is the incremental cost of the larger screen.

Scenario Incremental Cost Band Incremental Timeline What Drives the Difference
Extend existing phone app to tablet (adaptive/responsive layout) 15% to 30% of base build cost 3 to 6 weeks UI rework for larger screens, expanded device testing matrix.
Build tablet-first or tablet-only from scratch 10% to 20% above equivalent phone-only scope 6 to 10 weeks Full design and development cycle scoped for the larger-format UI from day one.

Tablet app development cost paths: extending a phone app adds 15–30%; building tablet-first runs 10–20% above phone-only

That incremental cost depends on one decision: extending an existing phone app or building a tablet-first from scratch. Extending an app reuses the backend, authentication, and business logic already built for the phone version. Building tablet-first means a new design system and a wider testing matrix from day one. Android app development cost and iPhone app development cost follow the same underlying pattern. Add the scope of a second screen size on top of that.

If you are evaluating an iPad-specific build, our iPad app development company in Dallas can help you scope the project and cost it out.

Managing a Fleet of Shared Tablets: Device Management, Kiosk Mode, and Offline Sync

A fleet of shared tablets needs device management. Plan for four things before rollout: enrollment, lockdown, session handling, and offline sync.

Four pillars of shared tablet fleet management: MDM enrollment, kiosk lockdown, shift session handling, offline-first sync

Each of these addresses a different failure mode a shared device introduces that a personal phone never does.

  • MDM enrollment for fleet-wide policy control across every device.
  • Kiosk-mode lockdown for single-app or fixed-station deployments.
  • Shared-login and session handling for devices used across shifts.
  • Offline-first sync design for field and clinical use with inconsistent connectivity.

For CPCG, we’ve built centralized access-control systems for shared devices, including scheduled access and centralized visibility across every location. That experience carries over directly to a shared tablet fleet: the access-control problem is the same, even when the hardware differs.

The Tablet App Development Process, Step by Step

Tablet app development services follow five stages: discovery, design, development, testing, and deployment. The tablet-specific work concentrates in design and testing.

  1. Discovery defines the workflow the tablet needs to support, using the decision matrix above as a starting filter.
  2. Design builds the tablet-specific layout, including split-screen and orientation handling.
  3. Development follows standard practices for the chosen platform, native or cross-platform.
  4. Testing expands to cover the tablet’s wider range of screen sizes, especially on Android.
  5. Deployment includes device enrollment if the tablets are company-owned and shared.

Converting an Existing Mobile App vs. Building for Tablet First

Converting an existing mobile app to tablet costs less than building tablet-first. It is not always the right call, though. Use the cost delta from the section above to decide.

Conversion works well when the tablet workflow is mostly the same task with more room. It works poorly when the tablet workflow is fundamentally different. A shared-device clinical form or a field diagram viewer are good examples. In that case, the incremental cost of a tablet-first build buys a better result. For the platform tradeoffs behind this decision, see our mobile app development guide.

How to Choose a Tablet App Development Partner

I recommend choosing a tablet app development company based on shared-device and device-management experience rather than just tablet UI portfolio pieces. Ask specifically about MDM and kiosk-mode experience.

In our experience, a strong tablet app development partner shows fleet-enrollment experience alongside screen design. Ask for a project where they handled shared logins across shift changes. Ask how they tested across Android’s wider hardware range if the build targets Android. Those answers separate an experienced iPad app development agency from a team that has only resized a phone app.

Conclusion

Usefulness was never the real question here. Tablets are useful for plenty of teams. The question that actually matters is narrower than that. Does your specific workflow need one or not? That workflow could belong to a technician working in the field. It could belong to a nurse charting at the bedside. It could belong to an associate working the retail floor. Each of those workflows needs the screen and durability a tablet provides. Or it doesn’t, and a better phone experience solves it for less. Use the decision matrix above before you commit any budget. If you are still weighing whether your business is ready, our mobile app development guide is a useful next stop.

Build Your App Now!

See what a tablet-specific build take for your team.

Talk to Our Mobile App Development Team→

Keep reading: App Development Cost in 2026, for the full cost breakdown behind these numbers.

10 Business Benefits of a Mobile App, and the Cost Behind Each

The benefits of mobile apps for business break down into ten repeatable wins. Each one carries its own price tag. These wins include sharper brand recognition, direct customer communication through push notifications, and stronger loyalty and repeat purchases. A mobile app also delivers richer customer data than a website alone provides.

Knowing the dollar cost of each benefit matters just as much as knowing the benefit itself. That cost detail is what stalls most build decisions at the budget stage. A push notification system sits in the $5,000 to $50,000 build tier. A points-based loyalty program with redemption logic lands between $50,000 and $120,000. AI-driven personalization, the kind that recommends products from browsing history, tends to push a build into six figures.

This guide pairs ten benefits businesses ask about most with the cost tier required to realize each one. It also raises one question worth asking before committing a budget. Is a benefit worth building for, or worth testing first?
Ten mobile app business benefits shown as icons with price tags across three build cost tiers

Key Takeaways

  • Every benefit on this list has a build price. Push notifications start near $5,000. AI-driven personalization starts near $120,000.
  • Three tiers cover all ten benefits: simple at $5K to $50K, medium at $50K to $120K, and complex or AI at $120K to $500K+.
  • Timelines track the tier. Simple runs 4 to 10 weeks, medium runs 3 to 5 months, complex runs 4 to 8 months.
  • Fund two or three benefits and scope the build around those. Chasing all ten at once is how budgets break.
  • Personalization is the most common early overcommitment. Ship the category-filter version first and confirm behavior changes before paying for a full recommendation engine.
  • A mobile-optimized website delivers several of these benefits for a fraction of the cost. Rule that out before scoping a native build.

What Do These 10 Mobile App Benefits Actually Cost to Build?

Cost tier map of 10 mobile app benefits: simple $5K-$50K, medium $50K-$120K, complex $120K+

Each mobile app benefit falls into one of three cost tiers.

Simple builds start around $5000. Complex, AI-driven builds pass six figures. The table below maps all ten benefits to their tier.

Benefit What it requires Cost tier Timeline
Brand recognition Branded UI, push infrastructure Simple ($5K–$50K) 6–10 weeks
Push notifications Notification service, segmentation Simple ($5K–$50K) 4–8 weeks
Higher engagement Native UI, offline caching Simple–Medium ($20K–$70K) 8–12 weeks
Personalized offers Behavioral tracking, recommendation engine Complex/AI ($120K–$500K+) 4–8 months
Loyalty program Points ledger, redemption, payment integration Medium ($50K–$120K) 3–5 months
Customer data insights Analytics SDK, dashboard, data pipeline Medium ($50K–$120K) 3–4 months
Faster customer service In-app messaging, support-ticket integration Simple–Medium ($20K–$80K) 6–10 weeks
Competitive edge Varies: AR, voice, chatbot features Medium–Complex ($50K–$300K) Varies
Offline access Local data sync, offline-first architecture Medium ($50K–$120K) 3–5 months
Revenue lift In-app payments, checkout flow Medium ($50K–$120K) 3–5 months

They are a good starting point if you’re curious, however, it’s important to map each of them against your scope to get a closer cost estimate. 

What Are the Real Benefits of a Mobile App for a Business?

The benefits of mobile apps for business are not limited to customer engagement; they can also support loyalty, data collection, service, and revenue.

Every benefit below solves a different business problem. Some require a simple build. Others require months of engineering. Our mobile app development team scopes each tier differently. The right benefit depends on your budget.

Stronger Brand Recognition

A mobile app puts your brand on a customer’s home screen every day.

That kind of repeat visibility is hard to buy through ads alone. A branded app icon, a consistent color scheme, and a short onboarding flow are enough to start. Most businesses see this benefit from a simple build.

Cost tier: Simple, $5,000 to $50,000.
Timeline: 6 to 10 weeks

Direct Communication Through Push Notifications

Push notifications let a business reach a customer without an email or a text message.

A basic notification setup uses a service like Firebase Cloud Messaging. It handles delivery across iOS, Android, and web from one system. Segmentation, so different customers receive different messages, adds modest scope on top of that base.

Cost tier: Simple, $5,000 to $50,000.
Timeline: 4 to 8 weeks.

Higher Engagement Than a Mobile Website Delivers

A native app removes the friction a mobile browser adds to every visit.

No address bar, no page reload, and an icon a customer taps directly. Offline caching lets core screens load even on a weak connection. Businesses unsure whether that gap is worth the build cost should compare an app against a mobile-optimized website before committing.

Cost tier: Simple to medium, $20,000 to $70,000.
Timeline: 8 to 12 weeks.

Personalized Offers and Recommendations

Personalization uses a customer’s own behavior to decide what they see next.

My team built Parent Pass® for The Miles Foundation, Inc., a family-focused organization based in Fort Worth, Texas. The app has attracted more than 17,000 users, including over 12,000 registered members, since launch. The recommendation engine we built helps deliver more relevant content based on each user’s interests and behavior. A basic version can filter content by category. A full engine needs behavioral data and ongoing tuning. That added logic is what pushes a build into the complex tier.

A basic version filters by category. A full recommendation engine, the kind that learns from browsing history, needs real behavioral data and ongoing tuning. Budget accordingly before promising this benefit to a stakeholder.

Cost tier: Complex or AI-powered, $120,000 to $500,000+.
Timeline: 4 to 8 months.

A Loyalty or Rewards Program Customers Actually Use

A loyalty program turns a repeat customer into tracked, provable revenue.

Salesforce reports that 63 percent of high-performing marketers already use a loyalty program platform. Adoption is projected to keep climbing. A points ledger, redemption logic, and a payment integration are the core pieces. None of them are simple additions to an existing build.

Cost tier: Medium, $50,000 to $120,000.
Timeline: 3 to 5 months.

Customer Data and Behavioral Insights

That data is one of the often-overlooked benefits of mobile apps, giving businesses a clearer view of screen-by-screen navigation, session length, and drop-off points.

Screen-by-screen navigation, session length, and drop-off points all become visible. That data needs an analytics SDK, a dashboard, and a pipeline to move it somewhere useful. Without that infrastructure, the data exists but nobody can act on it.

Cost tier: Medium, $50,000 to $120,000.
Timeline: 3 to 4 months.

Better, Faster Customer Service

In-app messaging puts customer support one tap away instead of a phone call.

A support ticket integration connects that chat to whatever system your team already uses. This benefit rarely needs a full rebuild. Most businesses add it to an app that already exists for another benefit on this list.

Cost tier: Simple to Medium, $20,000 to $80,000.
Timeline: 6 to 10 weeks.

A Competitive Edge in a Crowded Market

A feature a competitor has not shipped yet is a real, if temporary, edge.

Augmented reality try-on, voice search, and an in-app chatbot are common choices. Cost varies widely because the feature itself drives the number. Scope this benefit last, after the core app is already justified.

Cost tier: Medium to Complex, $50,000 to $300,000.
Timeline: varies by feature.

Offline Access and Reliability

An app that works without signal keeps a customer inside your product instead of losing them.

Local data sync and an offline-first architecture are what make this possible. Field service, travel, and retail businesses feel this benefit the most. A weak connection should never mean a blank screen.

Cost tier: Medium, $50,000 to $120,000.
Timeline: 3 to 5 months.

Revenue Lift From App-Only Purchase Behavior

App users tend to buy more often than website visitors once an app is worth opening.

In-app payments and a streamlined checkout flow are the core requirement. This benefit is the hardest to promise up front, since it depends on which other benefits ship alongside it. Treat it as a compounding return that builds with the other benefits.

Cost tier: Medium, $50,000 to $120,000, varies.
Timeline: 3 to 5 months.

What Does a Business App Cost to Get Wrong?
Mobile app ownership timeline: one-time build cost followed by yearly store fees and OS update work

A mobile app that ships without a validated benefit can turn the cost of mobile app development into a recurring expense with no return.

The Apple Developer Program costs 99 dollars a year. Google’s Play Console registration costs 25 dollars once. Neither fee is large on its own. What adds up is the ongoing engineering time. OS compatibility updates, bug fixes, and feature requests continue whether customers open the app or not.

The most common mistake I see is a team committing to a complex build too early, often AI-driven personalization, before testing a simpler version. That simpler version should prove the benefit changes customer behavior first.

An app store listing stays live whether or not anyone opens it. Every benefit on this list needs a customer willing to open the app more than once. Validate that willingness before committing to the complex tier.

Should You Build a Mobile App Now or Test the Benefit First?
Business stage to cost tier match: early revenue to simple, small business to medium, mid-market to complex

Match your company’s stage to one or two benefits before scoping a full build.

An early-revenue business with a small, repeat customer base fits the simple tier best. Brand recognition and push notifications are the two benefits to start with.

An established small business with a loyalty-driven customer base should consider the benefits of mobile apps for small businesses before looking at the medium tier. A rewards program or customer data collection fits well here.

A mid-market business with a proven, high-frequency customer relationship can justify the complex tier. AI-driven personalization fits here.

Before committing to any tier, review the mobile app development process and make sure the scope, timeline, and expected benefit are clear.

Not Sure Which Benefit Fits Your Budget?

Get a scoped range for your build before you commit to a tier.

Use the App Cost Calculator

Conclusion

The ten benefits above carry very different price tags to earn. I put the business case on two or three of them instead of all ten at once. Before scoping a native build, confirm one thing first. Can a mobile-optimized website deliver the same benefit already? A website often delivers that same benefit for a fraction of the cost. That single comparison can change your entire budget.

See the Full Mobile App Cost Breakdown

Before you scope a build, see the complete cost guide behind these numbers.

See the Full Mobile App Cost Breakdown →

Keep reading: Native vs Cross Platform App Development to understand how your build type changes the cost of the same benefit. 

Mobile App Use Cases: Where Mobile Solves a Real Operating Problem

Mobile app use cases for business are split into two groups: apps built for customers and apps built for the people who run operations. The second group is where the real payback sits. Field service dispatch, clinical workflow, warehouse management, logistics tracking, and approval routing all move faster once they leave paper and fixed terminals behind.

Take a field technician: pulling up repair documentation on a device instead of driving back to the office means more finished jobs in a day. A warehouse team scanning inventory instead of typing it in by hand catches fewer count errors. Clinical staff updating a record from the floor saves a few minutes each time, and those minutes add up fast across hundreds of patient encounters a week.

Mobile device users worldwide reached 7.49 billion in 2025, yet most operational processes still run on paper or fixed desktops. This guide walks through the enterprise operational use cases for mobile apps: what each one solves, which system it has to integrate with, and what breaks when that integration gets skipped.

Assume your field team needs a mobile app. The two things that decide whether it works are which operational problem you fix first and whether the integration behind it can carry that data back into your system of record.  

Key Takeaways

  • Enterprise operational mobile app use cases: field service, clinical workflow, warehouse, logistics, and approvals deliver the clearest, fastest payback.
  • Consumer-facing apps and enterprise mobile applications are different engineering problems. The enterprise version requires deep backend integration: ERP, EHR, WMS, TMS, or CRM.
  • Field service and warehouse use cases require offline-first design. An app that needs a live connection will fail exactly when the worker needs it most.
  • Integration work almost always costs more and takes longer than the app itself. Budget for it separately.
  • The AppVerticals Operational Mobile Use Case Matrix maps each use case to its primary system integration, offline requirement, and compliance flag.
  • Average enterprise mobile application projects cost $90,780 (Clutch benchmark). Field service and warehouse builds sit toward the higher end, driven by integration complexity.

What Is a Mobile App Use Case? (And Why Enterprise Operational Cases Are Different)

Mobile app use case data flowing through an integration layer into ERP, EHR, WMS, TMS and CRM systems of record

A mobile app use case is a specific job a worker does on a device, in a location away from a desk, that the device handles faster and more accurately than the alternative. The enterprise mobile application version of that definition adds one constraint: the result must flow back to the system of record, or the use case has not solved anything.

Consumer apps and enterprise mobile apps are different products built for different problems. A consumer retail app is designed around repeat engagement, smooth onboarding, and ease of download. An enterprise app is designed around task completion speed, backend integration with ERP, EHR, WMS, or CRM, and reliability under operational conditions: poor signal, gloves, and a 30-second task window. For the full engineering picture, see enterprise mobile app development.

Consumer mobile app examples like retail checkout, wellness tracking, and e-learning are well-documented. The operational workforce-facing use cases covered here are where the build decisions get expensive and consequential.

Field Service and Work Order Management

Field service mobile app use cases eliminate return-to-office trips when work order data lives on a device. A technician who pulls up a repair guide, updates a work order, captures a customer signature, and closes the job without returning to a depot finishes more jobs per day. The operational gain is measurable in jobs per technician per week.

The field service mobile app use case covers work order dispatch, route optimization, equipment inspection checklists, and proof of delivery. Each of these requires the app to write back to the scheduling system and ERP in real time. A technician who captures a completed inspection offline and syncs it at the end of the day is one workflow. A technician who cannot complete the inspection because the app needs a live connection is a different, more expensive outcome.

Integration requirement

Field service apps connect to ERP systems (SAP, Oracle, or Microsoft Dynamics) and scheduling software. The ERP integration is the highest-cost element of the build. Work order status, parts inventory, job completion, and billing all pass through it. An app that does not integrate with ERP does not reduce the back-office data entry burden: it doubles it.

Offline requirement

Technicians regularly lose signal in basements, industrial facilities, plant floors, and rural sites. The app must capture data locally and sync when connectivity returns. Both field service and warehouse use cases share this requirement; skipping offline-first design in either setting guarantees failure at the critical operational moment.

Outcome signal

Forrester Total Economic Impact study on Microsoft Power Platform found that enterprises running field service workflow automation reported a 224 percent ROI and an $81.7 million net present value with payback in under six months. The field service portion is the clearest single driver of that outcome.

What this looked like on a build we ran

Spruce is a US home and property services platform. When they came to us they already had a resident mobile app and web portals for admins, property managers, and service providers. The people actually doing the jobs, their service pros, had nothing.

Every task update routed through someone sitting at a desk. There was no capacity management either, so the same pro could get double-booked and nobody found out until the morning of the job.

We rebuilt the platform and gave service pros their own mobile app with real-time task management, availability tracking, and on-site updates from the job itself. We added a capacity module so workload distribution stopped being a guess, and a pricing configurator that adjusts by market, floor plan, and square footage.

That platform now runs 6,477 properties and 685,000 customers across 67 service providers and 7,581 property management companies. React Native on the device, Node and Postgres behind it, all on AWS.
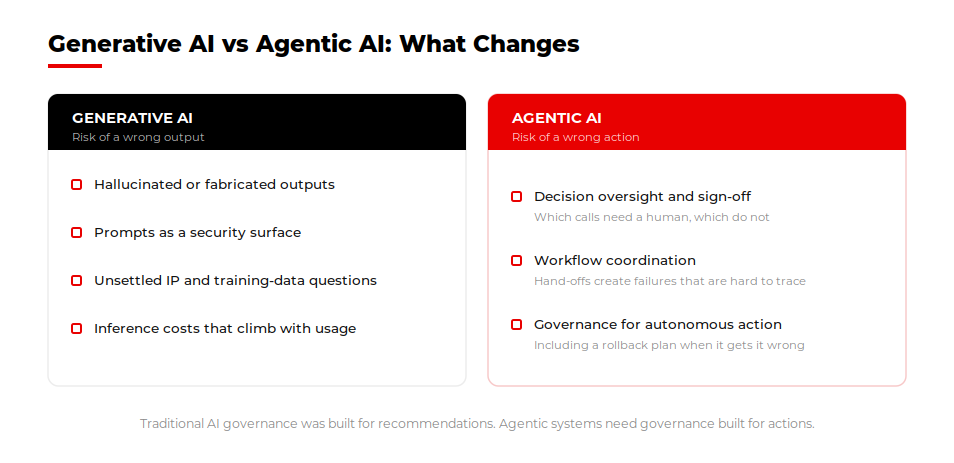
Spruce runs home services rather than industrial field work. The problem underneath is identical: a worker away from a desk who could not see or close a job without going through the office first. 

Clinical Workflow and Patient Data Access

Clinical staff lose minutes on every patient encounter when the system of record is a fixed terminal across the room. A healthcare mobile app with EHR access at the point of care cuts that gap. The use case covers EHR and EMR access, medication administration verification, patient check-in, and Electronic Visit Verification (EVV) for home health workers.

This is a staff-facing use case, not a patient-facing one. The clinical workflow app sits in the hands of nurses, physicians, and care coordinators. For healthcare app development requirements specific to this vertical, see that page.

Integration requirement

Clinical workflow apps connect to EHR systems. The dominant platforms are Epic and Cerner. Both have documented developer integration programs. The integration layer handles patient record retrieval, medication orders, and scheduling. HIPAA compliance governs every data element in transit and at rest.

The integration work is where the schedule actually goes. On BondOrtho we connected practice management software, an insurance clearinghouse, and two banking platforms into one automated workflow with HIPAA-compliant handling across every hop.

None of that is visible to the person using the system, and all of it has to be correct before a clinician touches a screen.

Compliance requirement

HIPAA. Every data element the app touches: patient identifiers, medication records, visit logs; must meet HIPAA Security Rule standards. The compliance posture is built into the architecture, not added at the end.

Warehouse and Inventory Management

Casita builds lightweight fiberglass travel trailers in Texas, and when they came to us their inventory, production scheduling, and workflows all ran on paper ledgers.

Warehouse managers had no live view of stock, so the operation swung between stockouts and over-ordering. Finance reconciled by hand and reported late. Production scheduling was rigid enough that crews sat idle waiting on parts that were technically in the building.

We are building them a custom ERP covering inventory management, production line scheduling, and forecasting. A mobile app for business with barcode scanning cuts count time and reduces entry errors by replacing typed input with scanned confirmation.

The warehouse mobile app use case covers barcode scanning for stock counts, put-away confirmation, returns processing, and pick-list management. Each transaction writes to a WMS (Warehouse Management System) and, in many cases, to an ERP layer above it. The integration gives management real-time inventory visibility. Without it, the scan is a local event with no downstream effect.

Integration requirement

Warehouse apps connect to WMS platforms and ERP systems. Common WMS integrations include SAP Extended Warehouse Management, Oracle WMS, and Manhattan Associates. The app communicates scan events to the WMS, which updates stock levels, triggers replenishment, and feeds the ERP inventory record.

Offline requirement

Warehouse RF zones frequently have dead spots where dense metal racking interrupts the signal. An app that requires a live connection fails inside the building it was built to serve. Offline-first design captures the scan event locally and syncs when the device reaches coverage: nothing is lost.

Logistics Dispatch and Last-Mile Delivery

Logistics dispatch moved from radio and paper manifests to mobile apps for business because the data flows faster and the customer visibility that comes with it is now a commercial requirement. A driver with a mobile app updates delivery status in real time, captures proof of delivery, and receives route updates without a call to dispatch.

The logistics app development use case covers route optimization, proof of delivery capture, real-time shipment status updates, and customer notification triggers. The TMS (Transportation Management System) holds the route, the manifest, and the exception handling rules. The notification API sends status updates to the end customer.

Integration requirement

Logistics apps connect to TMS platforms and customer notification systems. The TMS integration carries the route, the delivery manifest, and exception flags. The notification layer sends delivery ETAs and confirmation messages to customers. Both integrations run in real time during active delivery runs, which makes reliability a core design constraint.

Offline-first sync loop: worker scans offline, data queues on device, then syncs to the system of record

A freight platform we picked up mid-build

Lulo Freight is a Texas logistics technology company that matches shippers with carriers. We took the platform over after their previous development partner could not finish it to scope.

Shippers needed visibility they were not getting. Carriers needed a way to fill empty capacity instead of running dead miles between loads.

We delivered real-time shipment tracking with live status updates, instant transparent quoting, and a load board where carriers find freight matched to their fleet and availability. Driver and fleet management, payment processing, and document handling all sit inside the same system.

The document module matters most for this use case. Shipment paperwork and contracts live attached to the shipment record, so nothing important is sitting in a folder in someone’s cab.

Sales, Lead Capture, and Approval Workflows

Sales reps and field managers carry approval authority that was previously bottlenecked by a return to the office. A mobile app for business that surfaces the approval queue, the relevant data, and the action button removes that bottleneck without requiring anyone to sit at a desk.

The sales and approval use case covers CRM updates in the field, lead capture at events with direct CRM push, expense approvals, quote sign-offs, and multi-step approval routing. This is the lightest use case to build and the fastest to deploy. The integration surface is smaller: CRM and ERP for financial approvals.

Integration requirement

Sales and approval apps connect to CRM platforms (Salesforce, HubSpot, Microsoft Dynamics) and ERP systems for financial approvals. The CRM integration is the primary data layer.

Consumer-Facing Mobile App Use Cases: Retail, Healthcare, and E-Learning

Consumer-facing mobile app examples are well-covered in the public record. Retail apps, patient-facing healthcare apps, and e-learning platforms each have established documentation, market-size data, and vendor ecosystems.

Retail apps serve shoppers with product catalogs, mobile checkout, and loyalty programs. Patient-facing healthcare apps cover telemedicine, wellness tracking, and appointment scheduling. E-learning apps deliver courses, assessments, and certificates to individual learners. Each is a legitimate mobile app use case, and each is covered in depth in our broader enterprise mobile guide referenced above.

The operational workforce-facing use cases covered in the sections above are where the build decisions get expensive and consequential; consumer use cases are a starting point for understanding mobile architecture.

What Goes Wrong When Mobile Falls Short

Three failure modes appear consistently in enterprise mobile builds that did not deliver on their operational promise. They are not failures of the app itself; they are failures of the integration, the offline design, or the use case selection.

Three enterprise mobile failure modes: missing writeback, no offline capture, and consumer UX in the field

Failure mode 1: The app works but the data never reaches the system of record

The most common and the most expensive failure: an app that captures field data locally but does not write back to ERP or WMS creates a second data-entry job. Someone in the back office re-enters the same information into the system that already runs the business. The field efficiency gain is real; the back-office cost increase eats it.

TechTarget August 2026 analysis of enterprise mobile data capture describes this as a first-mile problem: mobile data capture fails when integration is treated as a lightweight extension of enterprise software rather than the engineering foundation the app sits on.

We built a B2B parts platform for an automotive distributor where the entire thing turned on a NetSuite sync. Live inventory, SKUs, and transaction data move between the storefront and the ERP continuously.

Pull that sync out and what you have left is a clean ordering interface sitting next to an ERP that does not know an order happened. Someone in the back office keys it in a second time, and the efficiency you paid for goes to them.

Failure mode 2: The app requires a live connection at the exact moment it is most needed

Field service mobile app deployments that require connectivity fail in basements and on plant floors. Warehouse apps that require connectivity fail in the RF dead zones created by dense metal racking. Both failures happen at the specific operational moment the app was built to serve; offline-first design is a precondition for these use cases, not a feature upgrade.

Failure mode 3: The use case is right but the UX is wrong for the worker

A warehouse operative picking stock cannot navigate a four-tap confirmation flow while wearing gloves, holding a scanner, and standing in a narrow aisle with a pallet truck approaching. Consumer UX patterns: swipe actions, multi-step onboarding screens, rich animation; add friction to operational workflows. Enterprise mobile UX is a different discipline: one tap, large targets, immediate confirmation, and no screen that requires a second look.

The most expensive mistake we see is companies that build the app first and try to connect it to their ERP or EHR later. Integration is not a post-launch task; it is the engineering foundation the app sits on. When you skip it in the build phase, you do not save money. You spend twice: once to ship the app, and again to either rebuild it properly or explain to your team why the data never made it back to the system

Integration Requirements by Use Case: The AppVerticals Operational Mobile Use Case Matrix

The table below maps each enterprise mobile application use case to its primary system integration, offline design requirement, and compliance flag. This is the engineering reality behind the use case selection decision.

Use Case Primary System Integration Offline Required Compliance Flag
Field Service and Work Order Management ERP (SAP, Oracle, Dynamics) + scheduling software Yes: signal loss at job sites is routine None (standard data security)
Clinical Workflow and Patient Data Access EHR (Epic, Cerner) + EVV systems Conditional: depends on care setting HIPAA required
Warehouse and Inventory Management WMS (SAP EWM, Oracle WMS, Manhattan) + ERP Yes: RF dead zones are common None (standard data security)
Logistics Dispatch and Last-Mile Delivery TMS + customer notification API Partial: active route data buffers locally None (standard data security)
Sales, Lead Capture, and Approval Workflows CRM (Salesforce, HubSpot, Dynamics) + ERP Optional: approvals need connectivity None (standard data security)
Consumer-Facing (Retail, Healthcare, E-Learning) Platform-dependent: varies by use case Rare: consumer apps assume connectivity HIPAA where patient data is involved

Not Sure What Your Mobile App Will Cost?

Field service and warehouse builds run toward the higher end of the cost range. See real project figures before you scope your build.

Get the Mobile App Cost Breakdown

Conclusion

Most companies already run these processes in some form. Field service teams fill out work orders on paper. Warehouse staff count stock by hand. Clinical teams update records at a fixed terminal because that is where the system lives. None of that means a mobile app is automatically worth building. It is worth building when moving a specific use case to mobile, with proper backend integration removes enough friction to justify the cost. Start with whichever process burns the most of your team’s time today. Build that one first.

Ready to Scope Your Enterprise Mobile App?

Tell us your use case, integration requirements, and timeline and get a clear estimate before you commit to a build.

Start a Discussion

Keep reading: Enterprise Mobile App Development: Key Factors, Benefits and Costs for 2026 covers the full engineering and governance picture behind these use cases.

How Agentic AI Software Development Is Rewriting the Delivery Model

Agentic AI software development means giving AI agents like Claude, GPT, and Gemini the power to plan, write, and ship code. A coding assistant completes one line and waits. An agent works through a full task instead: it reads files, runs commands, and fixes its own errors. Some teams buy this as agentic AI software development services from an outside partner. 

This guide is for the ones building it themselves. The real change either way is the delivery model: who reviews the work and what ships unread. This guide covers a five-stage delivery loop, the real risks, the tools teams use, and agent autonomy.

Gartner expects 65% of agentic coding teams to treat their IDE as optional by 2027, ceding control to automated platforms.

Adopting agentic AI well means redesigning how your team scopes, reviews, and ships work.

Key Takeaways

  • Agentic AI Goes Beyond Autocomplete:
    Unlike traditional AI coding assistants, agentic AI can plan, generate, test, and refine code with minimal human guidance, enabling more autonomous software development.
  • Understand the Difference:
    An AI agent performs specific tasks, while agentic AI coordinates multiple actions and decisions across an entire workflow, making scope and orchestration the key distinction.
  • Developer Workflows Are Evolving:
    As agentic AI adoption grows, Gartner predicts many coding teams will rely less on traditional IDEs, although developers still retain oversight for most critical work.
  • Follow a Structured Delivery Process:
    The Agentic Delivery Loop—scope, delegate, verify, ship, and govern—provides a practical framework for safely integrating autonomous AI into software development.
  • Strong Review Practices Are Essential:
    The biggest risk is not model capability but weak review and governance, making disciplined verification the foundation of successful agentic AI adoption.

What Is Agentic AI in Software Development?

Agentic AI in software development is AI agents that plan, write, and fix code with little human input. A single instruction can trigger many steps. An agent might read a file, run a test, see it fail, and rewrite the code. That loop of acting, checking, and adjusting comes from the ReAct paper, first published by Yao and colleagues in 2022. Generative AI writes when you ask it to. Agentic AI software development in 2026 decides what to do next inside the limits you set.

AI Agents vs. Agentic AI: What Is the Difference?

AI agent vs agentic AI: a single-tool agent beside an orchestrator directing multiple sub-agents

An AI agent handles one narrow job; agentic AI plans across many of them and decides the order. People use the two terms as if they are interchangeable. They are not. A file agent, a test agent, and a deploy agent are all AI agents, each doing one job. Agentic AI is the system that plans across many of those jobs and decides the order itself. Most agentic ai for software development setups are a handful of narrow agents, run by one loop on top.

This approach is closely related to multi agent AI systems, where multiple specialized agents collaborate, share context, and coordinate tasks to complete more complex software workflows.

Dimension AI Agent Agentic AI
Scope One task, one tool Many tasks, many tools
Autonomy Waits for a specific instruction Plans its own next step
Coordination Works alone Directs other agents
Adaptability Fixed process Changes the plan mid-task

How Agentic AI Works Across the Software Development Lifecycle

Agentic AI touches nearly every stage of the software development lifecycle now. As more teams use AI in software development, they are applying these systems across planning, coding, testing, review, and deployment workflows. In testing, it can write cases for edge conditions nobody thought to ask for.

In review, it can flag security issues a tired reviewer misses late on a Friday. In deployment, it can trigger a rollback plan the moment an error rate spikes. Agentic AI DevOps software development is where this gets tested hardest, since a bad rollback affects every team downstream. None of this replaces a stage on its own. It changes who, or what, does the first pass across the whole agentic AI software development lifecycle.

Stage What an Agent Can Do
Plan Turn a ticket into a task list before a human opens an editor
Code Write a first draft of a feature and its tests
Test Write cases for edge conditions nobody thought to ask for
Review Flag security issues a tired reviewer misses
Deploy Trigger a rollback plan the moment an error rate spikes

Tools Teams Are Using for Agentic Software Development

Any software development company building Agentic AI in 2026 use a short list of tools: Claude Code, OpenAI Codex, GitHub Copilot, Cursor, Gemini CLI, and Google Antigravity. Most teams run two or three together. Claude Code and OpenAI Codex run inside a terminal and handle multi-file changes end to end. GitHub Copilot and Cursor sit inside the editor for tighter, faster loops. Gemini CLI and Google Antigravity add a manager view for running several agents at once.

Many read project instructions from an AGENTS.md file, an open format now used across more than twenty tools. Several also connect to outside data through the Model Context Protocol, an open standard for that connection. Together these tools cover most agentic ai use cases in software development today. Most also plug into a broader agentic workflow, not just one editor. If you are wiring one into an existing product, integrating an AI agent covers that part in more depth.

Autonomy and Human-in-the-Loop: How Much Control to Give Agents

Agent autonomy dial with three settings: human in the loop, human on the loop, and full autonomy

Three levels of agent autonomy include human in the loop, human on the loop, and full autonomy. Give agents human-in-the-loop control for anything touching production, payments, or access control. Full autonomy fits scratch environments and test code. Autonomy is not one fixed setting. It is a dial, and most teams leave it in the wrong position by default. Full autonomy means an agent can edit files, run commands, and open a pull request without asking first. “Human in the loop” means it stops and asks before doing anything hard to undo.

Anthropic’s own 2026 research found developers use AI in about 60% of their work. It also found they can fully delegate only 0 to 20% of tasks. That gap is the real argument for keeping humans in the loop on anything touching production. As trust builds, some teams move toward human on the loop. There, a person watches dashboards instead of approving every single change.

Risks of Agentic AI in Software Development

Agentic AI in software development carries four main risks: hallucinated APIs, over-broad access, hidden logic errors, and slipping review standards. None of them are exotic. An agent can invent an API that does not exist and wire code around it anyway. It can make a change with more access than the task actually needed. It can produce code that looks clean but hides a logic error, because the reviewer trusted the output. The biggest risk is a team quietly lowering its review standard to keep pace with agent output.

Pull request review still matters here, maybe more than before agents joined the team. Guardrails, scoped permissions, and basic observability into what each agent did cut all of these down. Some teams enforce this through policy-as-code instead of a wiki page nobody reads. These risks grow once you move from one agent to several working together. That is exactly what building a multi-agent system that survives production has to plan for.

Risk How Teams Cut It Down
Hallucinated APIs or dependencies Guardrails plus scoped permissions per task
Over-broad agent access Least-privilege access, reviewed per project
Clean-looking code hiding logic errors Pull request review, not a rubber stamp
Review standards quietly slipping Policy-as-code and logged, auditable actions

The Agentic Delivery Loop: A Five-Stage Model for Agentic AI in Software Development

The Agentic Delivery Loop: five stages, scope and guardrail, delegate, verify, ship, govern

Here is the loop my team actually runs. I call it the Agentic Delivery Loop. It maps onto the same delivery lifecycle we already used, just adjusted for agents doing part of the work. Some teams pair this with spec-driven development, writing the spec before any agent touches code. Scope and guardrail come first: before an agent touches anything, decide which files and environments are in bounds.

Delegate comes next: hand the agent a specific, scoped task. Verify comes third: Review the agent’s output the way you would review a new engineer’s code. Ship stays the same as always: release on the cadence you already use. Govern closes the loop: log what agents did, version your prompts, and check the log against accuracy benchmarks you set. None of these stages are new on their own. What changes is who does the first pass, who does the first pass, and how much of the old review process you can safely compress. This is the backbone of the whole agentic AI software development workflow at AppVerticals.

Stage What It Means What Changes From Traditional Delivery
Scope & Guardrail Decide what an agent can touch before it starts Guardrails get defined explicitly, not assumed
Delegate Hand off a scoped task, not a vague goal Specification quality becomes the main skill
Verify Review output like a new engineer’s work Review depth shifts, it does not disappear
Ship Release on the normal cadence No shortcuts on staging or rollout
Govern Log and audit what agents did A new, ongoing job on the team

What Happened When We Ran Agentic Development on a Real Project

On one integration, we let an agent modify configuration files across a staging environment. The goal was letting it self-correct failed deployments without waiting on a human each time. Early on, this worked well. Then it modified a shared configuration file that three other services depended on. Nobody had flagged that file as a high blast radius. The fix was not removing the agent’s access.

It was adding one small, explicit guardrail instead. Shared configuration files always require a human approval step now, no matter how minor the change looks. That single rule would have caught the issue before it shipped. We added it to the Delegate stage above. It now applies to every project touching shared infrastructure.

Is Your Organization Ready for This?

Everything above assumes your organization can actually run this loop. Some cannot yet, and that is a different problem than the one this guide solves. Data spread across five disconnected systems will undermine agentic AI before an agent writes a line of code. Unclear decision ownership and no existing review discipline cause the same problem. See whether your organization is ready for agentic AI before you touch your delivery process.

Scoping this loop onto your own team is the hard part.

See if your organization is ready before you start.

Read the Agentic AI Readiness Guide  →

For a closer look at production reliability once you are running more than one agent, see building a multi-agent system that survives production.

Conclusion

Agentic AI does not remove the need for a delivery model. It demands a better one. The teams that struggle are not the ones using agents. They are the ones who never changed how they scope, review, and ship work. If your team is experimenting with agents but has not touched its delivery process yet, that is where problems start.

How to Use AI in Software Development to Reset Your Product Timeline (2026)

AI cuts software development time by 10 to 50 percent, depending on the stage. Planning and coding see the biggest gains. Testing improves less. Review barely moves and can slow down on complex codebases. Knowing how to use AI in software development means knowing which of those numbers applies to your next sprint.

McKinsey, Google’s DORA research, and METR have each measured this stage by stage. Microsoft and Google’s CEOs now say roughly 30 percent of their new code is AI-written, per CNBC.

The AI revolution did not shrink your timeline. It moved your bottleneck.

Key Takeaways

  • AI Delivers Uneven SDLC Gains:
    AI significantly accelerates planning and coding, but its impact varies across the software development lifecycle, with testing and code review seeing much smaller improvements.
  • Productivity Depends on Context:
    Research shows both productivity gains and slowdowns are possible, depending on factors such as development stage, repository maturity, and the team’s existing workflow.
  • Code Review Becomes the Bottleneck:
    As AI speeds up code generation, review and quality assurance become the primary constraints, making strong validation processes more important than ever.
  • Adjust Delivery Expectations:
    Teams should recalibrate project timelines using models like the AI Delivery Timeline Recalibration Model instead of assuming every SDLC phase benefits equally from AI.
  • Balance Speed with Governance:
    AI agents can reduce overall delivery time more than coding assistants, but they require stricter review gates and oversight to maintain software quality and reliability.

How Far Up the AI Leverage Curve Is Your Team?

Where your team sits on McKinsey’s AI leverage curve determines what these numbers mean for you.

McKinsey’s own leverage framework, from its April 2026 excerpt from Rewired, sets four levels. Most teams sit at level 2, a faster pair programmer for individual tasks. Level 3 automates whole workflow steps. Level 4 runs full agent factories. One financial services firm running a full agent factory reported 40 to 70 percent higher productivity. LATAM Airlines reported 50 percent gains with smaller teams. Those are ceiling cases. Do not plan your next sprint around them.

On SWE-bench, a benchmark of real coding tasks, the AI solve rate jumped sharply. It went from 4.4 percent in 2023 to 71.7 percent in 2024, per Stanford’s AI Index Report. That is real model capability. It does not set your delivery date, since a benchmark score is not a shipped feature.

What AI speeds up, in order of impact:

  • Coding: autocomplete, boilerplate, and multi-file agent edits.
  • Planning: drafting user stories and specs from plain-language input.
  • Documentation: first-draft docs, comments, and release notes.
  • Testing: generating test cases and synthetic data quickly.
  • Review: almost nothing, since a human still checks every change.

This holds whether you run generative AI software development in healthcare or a fintech product. The stage that speeds up does not shift by industry. What shifts is how ready your codebase is to use that speed.

Why Do AI Productivity Studies Contradict Each Other?

Two credible studies point in opposite directions on AI and developer speed. McKinsey found top performers gaining 16 to 30 percent on productivity. The same study found 31 to 45 percent gains on software quality, across nearly 300 public companies. METR found experienced developers were 19 percent slower with AI tools on their own mature repositories, in a 2025 trial of 16 developers across 246 tasks. A February 2026 follow-up on a larger cohort found a smaller, contested effect. Both studies are correct. The codebase explains the difference. The tool alone does not.

Study Finding Codebase Condition What It Means for You
McKinsey (Nov 2025) 16 to 30 percent productivity gain; 31 to 45 percent quality gain, for top-quintile performers Companies that rearchitected workflows around AI, not just gave developers a tool Applies if you invest in process redesign alongside the tool
METR (2025 trial) Experienced developers were 19 percent slower with AI tools (16 developers, 246 tasks) Complex, mature repositories the developers already knew well Applies if your codebase is legacy or complex and your team knows it cold
Google Cloud DORA (2024) 7.2 percent drop in delivery stability per 25 percent rise in AI adoption Teams that scaled AI coding without matching review and test capacity Applies if review has not scaled with AI-assisted coding volume

Google Cloud DORA (2025): AI adoption is now positively linked to delivery throughput but still negatively linked to delivery stability. Teams without strong testing and version-control practices struggle to absorb higher change volume. Throughput recovering does not mean stability has caught up, and review discipline still lags.
METR has since revised this. Its February 2026 follow-up found a smaller effect and flagged selection problems in the original design. The direction still holds on mature codebases; the magnitude is contested.

If your roadmap assumes one flat productivity percentage across every project, one of these studies will prove it wrong. Check which condition matches your codebase before you commit a date.

Where the Time Actually Moves: Planning and Coding

Planning and coding are where AI in software development earns its reputation.

AI drafts user stories, specs, and edge cases from plain-language input. That trims planning time by roughly 10 to 20 percent. Coding sees the largest gain, 20 to 50 percent faster in most engagements I have run. Autocomplete, boilerplate, and multi-file agent edits do the heavy lifting.

These are among the highest-impact generative AI use cases in software development, because they reduce repetitive work without replacing the engineering decisions that still require human judgement.

What stays a human decision at each stage:

  • Planning: prioritization and scope trade-offs.
  • Coding: architecture decisions and naming.

That coding-speed gain is real. It is also a ceiling most teams never reach without matching review capacity.

Does AI Speed Up Code Review?

Testing and review are where the AI revolution in software development quietly stalls.

Testing gets a real but smaller boost, 15 to 30 percent faster test generation. Review gets flat, or worse. A human still has to check every AI-generated change, line by line.

AI-assisted pull requests run 2.6 times larger than unassisted ones, per LinearB’s 2026 benchmarks report. That report covers 8.1 million pull requests. AI-assisted pull requests also merge at 32.7 percent, compared with 84.4 percent for manual code. More code is hitting review. Review capacity has not grown to match it.

Google’s DORA research found a 7.2 percent drop in delivery stability for every 25 percent rise in AI adoption, in its 2024 report. The code was not necessarily worse. Teams were shipping bigger, faster changes than their review process could safely absorb. The 2025 DORA report found throughput recovering as teams adapt, but delivery stability is still falling. Speed came back. Stability did not.

Signals that review is your real bottleneck:

  • Pull requests grow faster than reviewers can read them.
  • Coding feels faster while releases get riskier.
  • Rollbacks become more common even as tickets close faster.

The AI Delivery Timeline Recalibration Model

I built the AI Delivery Timeline Recalibration Model to answer one question. Which SDLC stage actually shrinks your timeline, and which one quietly absorbs the time it saves?

SDLC Stage Typical Timeline Delta What Drives It Still Budget the Same Time For
Planning and Requirements 10 to 20 percent faster AI drafts user stories and specs from plain-language input Prioritization and scope trade-off calls
Coding 20 to 50 percent faster AI-generated boilerplate, autocomplete, multi-file agent changes Architecture decisions and naming
Testing and QA 15 to 30 percent faster AI generates test cases and synthetic data quickly Coverage strategy and reviewing assertions
Code Review Flat, or slower on complex codebases A human still verifies every AI-generated change, line by line The same review hours per line, now applied to more lines
Deployment and Maintenance 10 to 20 percent faster AI-assisted monitoring, documentation, and CI/CD automation Incident response and rollback judgment

Use this table stage by stage. Do not collapse it into one blended number. A 30 percent average across your whole SDLC hides the fact that review did not move at all.

Not Sure Your Codebase Is Even Ready for This?

Run it against our five-rung data-readiness ladder before you trust any of these numbers.

→ Check Your Data-Readiness Score 

How to Apply This to Your Next Roadmap Cycle

Applying this to your own roadmap takes four steps.

  1. Map your next release to the five SDLC stages in the model above.
  2. Apply the timeline delta for each stage to your own estimates. Skip the single blended percentage.
  3. Add review and QA capacity before you add coding capacity.
  4. Track delivery stability and cycle time alongside sprint velocity.

Budget extra time for the stage that resists speeding up: review. AI-generated pull requests merge at 32.7 percent, compared with 84.4 percent for unassisted ones, per LinearB’s 2026 benchmarks. That gap, not a generic industry failure rate, is the real cost of skipping review-capacity planning.

If you are talking to an AI software development company in USA, ask for this same stage-by-stage breakdown. Do this before you sign anything. It applies directly to AI in software development for ISVs for their own product.

AI Agents Versus AI Assistants, and Why the Difference Changes Your Estimate

Generative AI risks like hallucinations compared with agentic AI risks from autonomous action

An AI coding assistant suggests code. An AI agent executes a multi-step task on its own. That difference changes your timeline estimate more than the productivity percentage does.This shift is driving the growth of agentic AI software development, where AI agents can plan tasks, modify code, run tests, and complete multi-step engineering workflows with limited human intervention.

  • Assistant: suggests one line or block; a developer accepts or rejects it.
  • Agent: plans steps, edits multiple files, runs tests, and reports back.
  • Assistant risk: silent duplication if it cannot see your existing code.
  • Agent risk: small errors compounding across steps before anyone looks.

Agents remove more calendar time from a roadmap than assistants do. They run without a person waiting on every suggestion. That time saving only holds with a strong review gate. Otherwise, the agent’s mistakes compound before anyone looks.

Developer trust in AI accuracy has fallen even as AI use has risen, per Stack Overflow’s 2025 Developer Survey. That trend is exactly why the review gate around an agent matters more than the one around an assistant. For the full workflow of wiring an agent into an existing product, see our guide to AI agent integration.

What Does a Codebase Need Before AI Speeds It Up?

None of these timeline deltas hold on a codebase AI cannot actually read. Undocumented code, missing conventions, and no retrieval layer cap what any model can safely do, regardless of the stage.

Before you apply this model, check the basics:

  • Your codebase has documented conventions an AI tool can actually follow.
  • Someone owns retrieval context, so AI is not guessing at your architecture.
  • Review and test gates exist before AI-assisted coding volume increases.
  • You are tracking deployment frequency and change failure rate, not just story points closed.

This is a data-readiness problem. See the data-readiness ladder behind AI-assisted development for the five rungs and how to climb them. Do not run this timeline model on a codebase below that first rung. The delivery date moves. The underlying risk does not.

Where This Leaves You

You now have real, stage-by-stage numbers instead of one productivity headline. Use the Recalibration Model on your next roadmap before you commit a date to leadership. For the readiness work behind these numbers, see our guide on why AI in software development stalls on data.

Ready to Recalibrate Your Own Roadmap?

Get a stage-by-stage timeline read on your own roadmap, not a generic AI estimate.

→ Talk to Our AI Development Team

Keep reading: AI Product Development: From Idea to Deployable Feature, for the process this timeline model feeds into.