













 ChatGPT
 Perplexity
 Claude
 Google AI
Android app development cost in 2026 runs from $30,000 for a scoped MVP to $300,000 and beyond for a regulated or AI-heavy product. Most funded builds I scope land between $60,000 and $150,000.
I have scoped estimates for multiple android apps. The four key decisions that set your number mostly includes: how many device classes you support, how much of the backend you own, how deep QA goes, and where your team sits.
Android carries a labor-rate advantage, because Kotlin and Java developers generally bill below their Swift counterparts. It also carries a testing penalty, since a Pixel, a Samsung foldable and a five-year-old budget handset behave like three different targets. Publishing costs a one-time $25 Google Play Console registration fee, while Play’s service fee tiers and the annual target API level requirement carry real ongoing cost.
Here is what each line in an Android app development quote is actually funding, and how to compare two quotes that assume different things.
A cheap quote and an expensive quote for the same app are usually describing two different apps.This guide explores why Android app development costs vary so widely in 2026, what each pricing tier actually includes, and which decisions have the biggest impact on your budget, timeline, and long-term maintenance costs.
Key Takeaways:
- Android app development cost: Typically ranges from $30,000 to $300,000+, with most funded builds falling between $60,000 and $150,000.
- Device support impacts budget: The number of Android devices, screen sizes, and OS versions you support can significantly change development and testing costs.
- Team location affects pricing: The same Android app scope can vary by 2–3x depending on where your development team is based.
- Platform costs add ongoing expenses: Google Play fees, API requirements, hosting, payments, maps, and messaging services contribute to long-term app ownership costs.
- Maintenance is part of the budget: Expect to spend around 15% to 25% of the initial build cost annually on updates, fixes, and improvements.
- Quotes vary because scope varies: Large pricing differences usually reflect changes in backend ownership, features, integrations, and overall product complexity.
What Does Android App Development Cost in 2026?
The most useful way to think about budget is by what the product has to do. Screen count tells you very little. Two apps with fifteen screens each can differ by $100,000 once you look at what sits behind those screens.
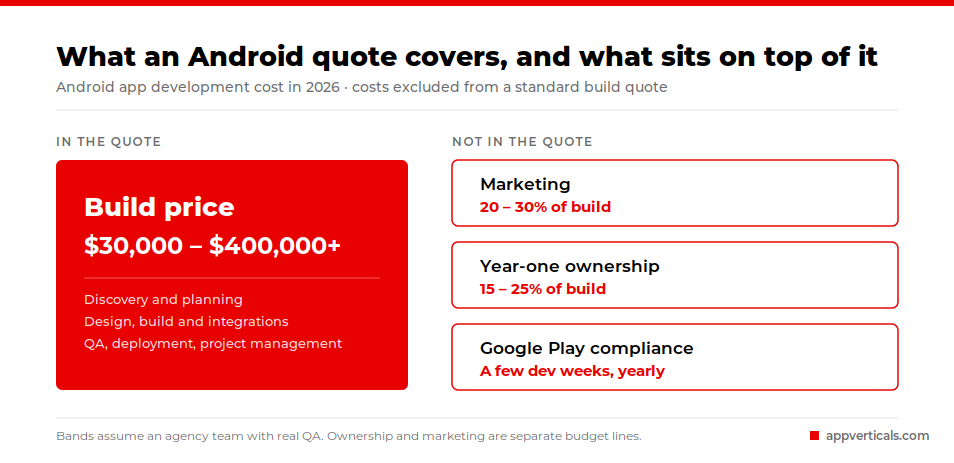
Here are the cost bands I use when scoping Android app development services. Every other table in this article ladders into these numbers.
| App Tier | What It Typically Includes | Android Budget | Typical Timeline |
|---|---|---|---|
| Scoped MVP | One core job, single user role, light backend, basic authentication, limited device support | $30,000 – $60,000 | 3 – 4 months |
| Standard Product | Multiple roles, custom backend, payments or subscriptions, admin panel, analytics | $60,000 – $150,000 | 5 – 8 months |
| Complex Product | Marketplace or on-demand flows, real-time features, offline sync, heavy integrations | $150,000 – $250,000 | 8 – 12 months |
| Regulated or AI-Heavy | Fintech or healthcare compliance, audit trails, LLM workflows, enterprise integrations | $250,000 – $400,000+ | 10 – 16 months |
The bands assume a professional agency team with real QA, and they assume the price includes discovery, design, build, testing, deployment and project management.
They exclude post-launch ownership, which I cover further down and which people underestimate more often than any other line. They also exclude marketing, which routinely runs 20% to 30% of the build budget on top.
Factors Affecting the Cost of Android App Development
Scope is still the biggest lever, and it is the one clients have the most control over. A content app, a booking app and a HIPAA-sensitive patient app can all be described as “an Android app” while creating completely different engineering loads.
The table below gives the six levers I check on every estimate, with the budget impact I typically see and the way to keep each one under control.
| Cost Lever | Typical Budget Impact | Why It Moves the Number | How to Control It |
|---|---|---|---|
| Product Scope | 30% – 50% of total | More roles, flows, and edge cases mean more development effort and QA coverage | Lock the first release to one core job |
| Backend and Integrations | 25% – 40% of total | Authentication, payments, sync, dashboards, and search complexity compound quickly | Use proven services where the logic is not your differentiator |
| UI/UX Depth | 15% – 20% of total | Custom flows, animations, and design systems require more iteration | Spend design effort where it impacts conversion or retention |
| Android Device Coverage | 15% – 25% of total | Each additional device class and OS version multiplies testing requirements | Define device and OS support limits before development begins |
| Security and Compliance | 10% – 30% where applicable | Regulated products require additional architecture, auditability, and documentation | Match compliance investment to actual business and regulatory risk |
| Timeline Pressure | 10% – 20% premium | Compressed timelines require parallel workstreams and additional coordination | Phase releases instead of compressing the entire roadmap |
The device coverage row is the one people skim, and it is the one that most often breaks an Android budget. Android runs across handsets from Samsung, Xiaomi, OnePlus and Google, each with its own interface layer and its own quirks.
Every one of those layers can produce a bug that exists nowhere else. Deciding your minimum supported devices early converts an open-ended testing commitment into a fixed, priceable one.
Android Developer Rates by Region
Where your team sits changes the same scope by a factor of two or three. These are the bands I see in the market, and they also align with the rates published in our iPhone app development cost guide.
| Region | Typical Hourly Rate | Notes |
|---|---|---|
| United States and Canada | $80 – $180 | Highest rates with the deepest overlap with US business hours |
| Western Europe | $70 – $150 | Strong engineering depth with GDPR fluency built in |
| Eastern Europe | $35 – $80 | Common sweet spot for funded startups balancing cost and technical depth |
| Latin America | $35 – $75 | Rates close to Eastern Europe with better US time-zone overlap |
| South Asia | $20 – $55 | Widest quality range; portfolio, communication, and process matter most |
| Southeast Asia | $25 – $55 | Growing senior talent pool, strong fit for long-term maintenance |
Senior architects and technical leads command a premium in every region, and that premium is generally worth paying at the architecture stage. An architecture decision made badly in month one gets paid for every month afterwards.
Rate is the easiest number to compare and the least useful one on its own. A $40 per hour team with a clear process and daily reporting frequently outperforms a $120 per hour team without either.
If offshore delivery is on your table, our guide to outsourcing Android app development covers how to vet for the process part instead of the rate part.
One warning about the bottom of the market
You will find Android work advertised for a few hundred dollars, and that price is real for what it delivers. It buys a template, a thin wrapper around a website, or a single developer working without design, QA or a backend. That can be the right purchase for a throwaway proof of concept. It is a different product from the ones priced in this article, and the two get compared far more often than they should.
How Much Does Android App Development Cost by Phase and Role
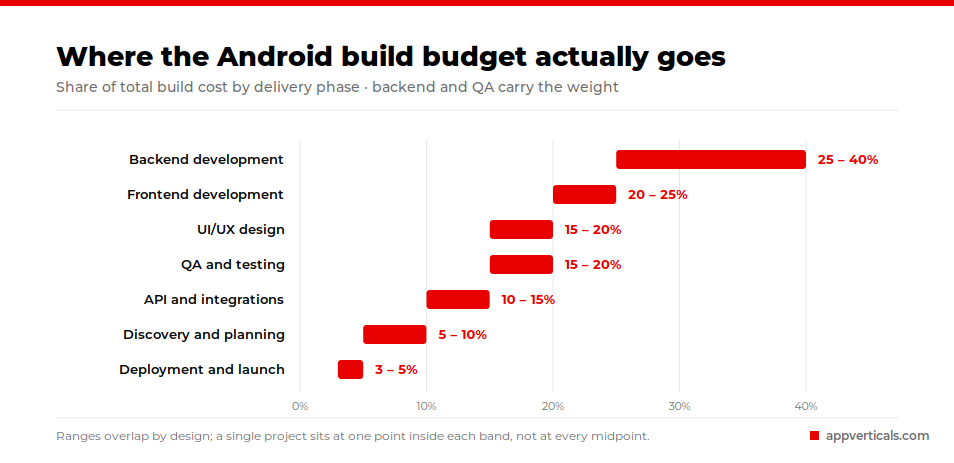
Clients often ask why a quote cannot just be a development number. The build itself is usually a little over half of it.
Here is how a typical Android budget distributes across delivery phases.
| Phase | Share of Total Budget | What It Buys |
|---|---|---|
| Discovery and Planning | 5% – 10% | Requirements, feature scoping, and the PRD (the written specification everyone builds against) |
| UI/UX Design | 15% – 20% | Wireframes, visual design, prototypes, and design system creation |
| Frontend Development | 20% – 25% | Screens, navigation, state handling, and layouts across different screen sizes |
| Backend Development | 25% – 40% | APIs, databases, authentication, business logic, and cloud infrastructure |
| API and Third-Party Integrations | 10% – 15% | Payments, maps, notifications, analytics, and social login integrations |
| QA and Testing | 15% – 20% | Functional testing, performance testing, security checks, and user acceptance testing |
| Deployment and Launch | 3% – 5% | Store submission, release setup, monitoring, and launch configuration |
Backend regularly becomes the heaviest line on complex products, and Android spends more on QA than most platforms because of the device matrix.
The same budget also breaks down by who is doing the work, which is the view I find most useful when a client is comparing two proposals.
| Role | Scoped MVP | Standard Product | Complex Product |
|---|---|---|---|
| Android Developers | $18,000 – $32,000 | $35,000 – $70,000 | $80,000 – $140,000 |
| Backend Developers | $8,000 – $16,000 | $20,000 – $45,000 | $50,000 – $90,000 |
| UI/UX Designer | $4,000 – $8,000 | $9,000 – $18,000 | $20,000 – $35,000 |
| QA Engineer | $4,000 – $9,000 | $10,000 – $22,000 | $25,000 – $45,000 |
| Project Manager | $3,000 – $7,000 | $8,000 – $16,000 | $18,000 – $30,000 |
| Solution Architect | $2,000 – $5,000 | $6,000 – $12,000 | $15,000 – $25,000 |
If a proposal shows a single number with no role split, ask for one. The shape of the team tells you what kind of product you are being sold.
Cost of Android App Development By Feature
Feature-level pricing is the fastest way to see where a budget is going, and the fastest way to find things worth cutting from a first release.
| Feature | Typical Cost | Why It Costs That |
|---|---|---|
| Email and Social Sign-In | $1,500 – $4,000 | Well-trodden feature; cost increases with role logic and account recovery flows |
| User Profiles and Settings | $2,000 – $5,000 | Scales with how much user data, preferences, and account state the app manages |
| Push Notifications | $1,500 – $4,000 | Sending is simple; segmentation, scheduling, and notification logic add complexity |
| Search | $3,000 – $8,000 | The cost comes from indexing, filters, and relevance tuning rather than the search box itself |
| Payments and Subscriptions | $5,000 – $15,000 | Billing states, retries, refunds, receipts, and edge cases drive the effort |
| In-App Chat | $4,000 – $12,000 | Real-time delivery, read states, moderation, and message history add complexity |
| Maps and Geolocation | $4,000 – $10,000 | Background location tracking and battery optimization are the challenging parts |
| Admin Panel or Back Office | $8,000 – $20,000 | Often functions as a second product with separate workflows and permissions |
| Offline Mode With Sync | $6,000 – $16,000 | Conflict resolution and data synchronization logic require most of the engineering effort |
| Advanced Analytics | $2,000 – $6,000 | Requires event tracking, instrumentation, reporting, and dashboard development |
| AI Assistant or LLM Workflow | $10,000 – $50,000 | Includes AI integration, workflow design, testing, and recurring inference costs |
AI features deserve a second look before they enter a first release. The build number above is only part of it, since inference charges recur every month and scale with the number of people using the feature.
Managed APIs make a sensible starting point for a startup. Model the monthly cost at ten times your launch usage before you commit, because the surprise arrives at growth, well after launch.
To see where your own scope may fall within these bands, use our cost calculator to generate a starting estimate based on your features, platforms, and product complexity.
Want a rough number first?
Answer a few questions about scope and features and get a ballpark Android range in about two minutes. No call, no form.
Try the app development cost calculatorAndroid vs iOS App Development: Which Actually Costs More?
This is the question I am asked most often, and clients usually arrive having heard both answers from different people. One source told them Android is cheaper. Another told them Android costs more.
Both camps are describing something real. Two forces pull in opposite directions, and which one wins is decided by a variable you already know.
The rate force pulls Android down. Kotlin and Java developers generally bill below Swift developers, so on identical scope the labour line comes in lower.
The surface area force pulls Android up. iOS runs on a controlled set of devices, while Android spans thousands of models, several manufacturer interface layers and a much longer tail of OS versions still in active use. That difference lands almost entirely in QA.
So the answer depends on how many device classes your product commits to supporting. I call it the rate versus surface area rule, and it resolves the contradiction cleanly.
| Product Profile | Device Classes | Which Force Wins | Net Cost vs. Equivalent iOS Build |
|---|---|---|---|
| Internal Tool on Company-Issued Handsets | 1 – 2 | Rate advantage | 5% – 15% cheaper |
| Consumer App, Phones Only, Recent OS Floor | 3 – 5 | Roughly balanced | Within 5% either way |
| Consumer App, Phones and Tablets | 6 – 10 | Surface area | 10% – 20% dearer |
| Phones, Tablets and Foldables, Wide OS Floor | 10+ | Surface area | 20% – 30% dearer |
The practical takeaway sits in the left column. You control your device floor, and it is a business decision more than a technical one.
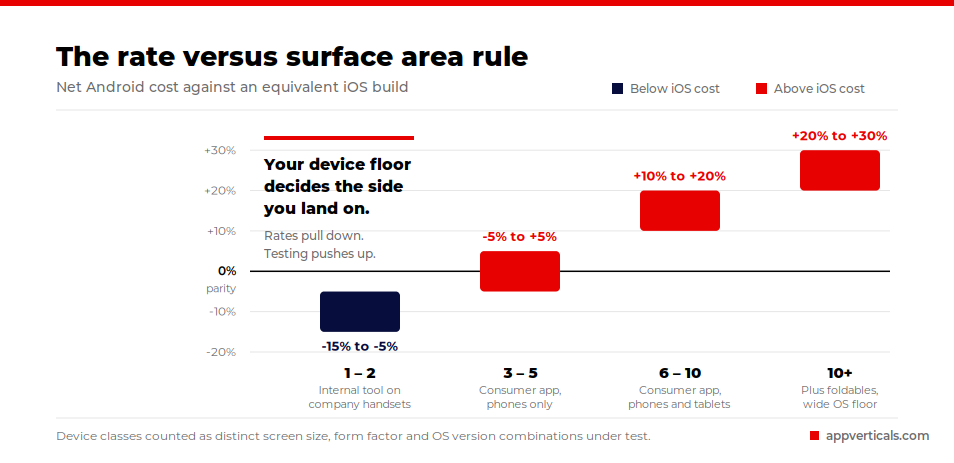
Supporting handsets seven years old to reach an extra slice of the market is a legitimate choice. Make it deliberately, with the QA cost attached, instead of discovering it in month four.
Native or Cross-Platform for Android
Cross-platform delivery with Flutter or React Native shares one codebase across Android and iOS, and it reduces a two-platform build by roughly 30% to 50% when the product suits it. Native Android earns its premium when the product leans on the camera, sensors, AR, background services or heavy on-device processing.
Products that are mostly screens, forms and API calls are usually well served by a shared codebase. If you are weighing the two approaches in detail, our cross-platform development page walks through where each one holds up.
Google Play Economics: Fees, Tiers and the Compliance Floor
Publishing on Android has a low entry cost. Google Play Console registration is a one-time $25 fee, which covers you for every app you ever publish under that account.
Google takes a service fee on digital goods and subscriptions sold inside the app. The headline rate is 30%, a reduced 15% tier applies to developers under $1 million in annual revenue, and subscriptions are generally charged at the lower rate.
Apps selling physical goods or services pay Google nothing on those transactions. You use a payment processor instead and pay their rate, typically a small percentage plus a fixed fee per transaction. Our Google Play Store statistics breakdown covers the platform numbers in more detail.
Then there is the part almost nobody budgets for. Google Play enforces a target API level requirement, and it moves every year.
An app that falls below the current threshold stops being distributable to new users. Meeting it means real engineering work on a schedule Google sets for you.
I treat this as a standing annual line item in every Android ownership budget I build. It typically costs a few developer weeks a year on a mid-sized product, and it is the single most common reason a client who thought they were “done” gets an unexpected invoice.
Plan for it in year one, and the requirement becomes routine maintenance. Ignore it, and it eventually arrives as an emergency.
What It Costs to Own an Android App After Launch
Shipping version one moves you from build costs to ownership costs. Annual maintenance runs 15% to 25% of the original development cost, depending on release cadence and how fast the product changes.
On top of that percentage sit the running costs, which are easy to underestimate individually and material in aggregate.
| Ongoing Cost | Typical Range | Notes |
|---|---|---|
| Cloud Hosting | $200 – $2,500 / month | Scales based on user volume, stored data, and processing requirements |
| Mapping and Location APIs | $200 – $1,500 / month | Usage-billed services that can increase quickly with active users |
| Analytics and Crash Monitoring | $0 – $500 / month | Free tiers are usually enough during early product stages |
| Messaging and Notification Services | $0 – $500 / month | Costs depend on message volume and delivery frequency |
| Payment Processing | ~2.9% + fixed fee per transaction | Applies to external payment processors outside Google Play billing |
| Android Compatibility Work | Few developer weeks / year | Required for new OS versions, device releases, and target API level updates |
The last row is Android-specific and belongs in every plan. New OS releases and new hardware arrive on a schedule, and an app that goes unmaintained through two of those cycles becomes noticeably more expensive to bring back.
Broader post-launch cost planning across platforms sits in our mobile app development cost guide.
Inside a Dual-Native Android Build
A US outdoor-living manufacturer came to us with a problem their sales team had lived with for years. Customers could not picture how a particular stone coping would look around their own pool, so decisions stalled, orders got delayed, and some finished projects disappointed people who had approved them on a sample board.
What they needed was for a homeowner to stand at their own pool, hold up a phone, and see the finished result in place. That requirement made almost every technical decision for us.
We built it as a genuinely dual-native product, with a native Android app and a native iOS app sharing a .NET backend and a set of Python and Azure Functions microservices. The app scans the pool surroundings using augmented reality, stitches multiple images into one continuous view of the space, and plots the selected coping onto the pool using geometric algorithms with an AI-assisted plotter. Customers adjust the design in real time and order directly through the app.
Why native, when a shared codebase would have been cheaper upfront.
The product lives in the camera pipeline, and it depends on frame timing, sensor data and surface detection behaving predictably.
Cross-platform frameworks handle a great deal well, and camera-plus-AR work at this level is where their abstraction layers start costing more than they save. Choosing native cost more in month one and avoided a rebuild we could see coming.
Where the Android side got expensive.
The AR and image-stitching work had to hold up across a far wider range of cameras, sensors and processing capabilities than the iOS build ever encountered.
Surface detection that behaved perfectly on one flagship handset needed real tuning on mid-range hardware with a different camera stack. That validation work was a meaningful share of the Android budget, and it is exactly the cost the device-floor conversation exists to make visible in advance.
The lesson generalizes past AR. When a product depends on hardware behaving consistently, the Android device floor stops being a QA detail and becomes one of the largest single levers on your budget.
How to Compare Two Different Android App Development Quotes
Most clients I meet are holding two or three proposals that differ by a factor of two, and they are trying to work out which one is honest. In my experience the gap is rarely efficiency. It is assumptions, and the cheaper quote is usually the one that wrote fewer of them down.
Work through the eight lines below against each proposal you are holding. Mark every line as included, excluded, or unstated.
| Assumption Line | In the Quote? | If Unstated, What It Typically Adds |
|---|---|---|
| Minimum Devices and Screen Classes Supported | In / Out / Unstated | 10% – 20% in QA effort once the actual device list appears |
| Minimum Android OS Version Supported | In / Out / Unstated | 5% – 15%, with larger increases when supporting much older OS versions |
| Backend Build vs Third-Party Services | In / Out / Unstated | Highly variable; often the largest cost swing in the project |
| QA Depth: Manual, Automated, Security, UAT | In / Out / Unstated | 10% – 20% depending on testing coverage required |
| Who Owns Third-Party Accounts and Running Costs | In / Out / Unstated | Can shift ongoing monthly expenses to you after launch |
| Post-Launch Support Window and Coverage | In / Out / Unstated | 15% – 25% annually once maintenance and support begin |
| Change Requests: Volume and Pricing Method | In / Out / Unstated | 10% – 20% impact across a typical build |
| Contingency Built Into the Estimate | In / Out / Unstated | 10% – 20% buffer depending on project uncertainty |
A quote with four unstated lines is not cheaper than one with none. It is less finished, and the missing work reappears later as change requests.
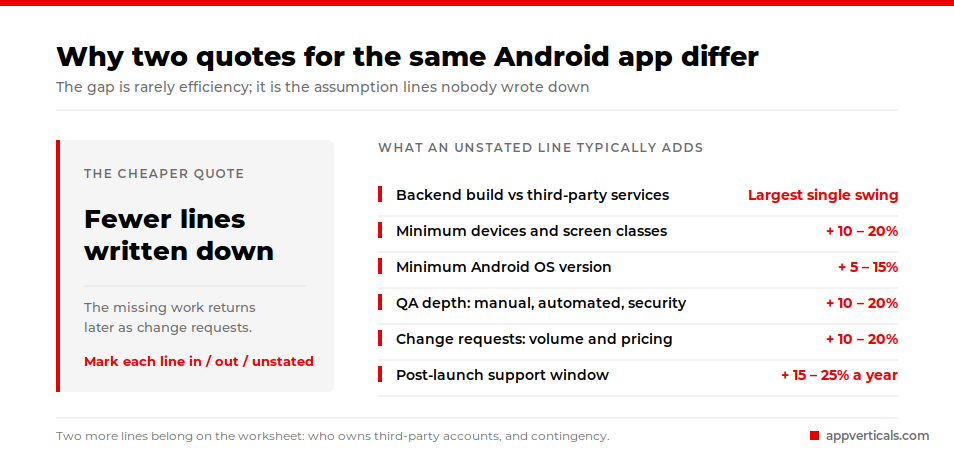
Ask both teams to fill in their own version of this table. How readily they do it tells you a great deal about how the project will run, and our guide to choosing an Android developer covers what else to look for at that stage.
How to Reduce Android App Development Cost Without Building Debt
Cutting cost well and cutting cost badly look identical for about four months. Here is what has held up across the projects I have priced.
Scope to an outcome, not a feature list. Fund the smallest version that proves demand, retention or revenue. Feature count inflates budgets faster than it creates value, and a first release exists to earn the second one. Our MVP development approach is built around exactly that sequencing.
Set the device floor on day one. This single decision moves more Android budget than any other, and it costs nothing to make early. Pull your target market’s actual device distribution and choose deliberately.
Buy the commodity parts. Authentication, payments, analytics, messaging and file storage are solved problems. Building them from scratch spends real money on something that will never differentiate you.
Freeze scope and treat every change as a budget decision. Uncontrolled change requests drain more budgets than bad estimates do. Short cycles with a working build at the end of each one catch problems while they are still cheap.
Interrogate a quote that comes in far below the rest. A low number can reflect a narrow scope, template architecture, thin QA, no post-launch support, or a rewrite deferred into next year. Any of those may be acceptable, provided you know which one you are buying.
Conclusion
The budget conversation gets much easier once you stop asking what an Android app costs and start describing which version of the product you are funding, for which devices, at what quality bar. Every number in this article moves with those three answers.
Teams that set a device floor early, price ownership honestly and compare proposals on assumptions instead of totals are the ones that launch close to budget. If you are holding quotes right now, run them through the eight-line worksheet above before you sign anything.
Get an Android quote with the assumptions written down
We scope your device floor, backend ownership, integrations and QA depth into a costed plan, so you can see what every line is funding before you commit to anything.
Explore our Android app development services