













 ChatGPT
 Perplexity
 Claude
 Google AI
App development cost in 2026 runs from roughly $25,000 for a single-platform MVP to $400,000 and beyond for a compliance-heavy enterprise build. Most funded products land between $60,000 and $180,000. Those are averages across very different scopes, which is why two quotes for the same brief can look nothing alike.
I spend most of my week on estimation calls, and by the time someone reaches me they have usually stopped asking what an app costs. They have two quotes on the desk, four times apart, and they want to know which one is honest. Both usually are. They are pricing different products.
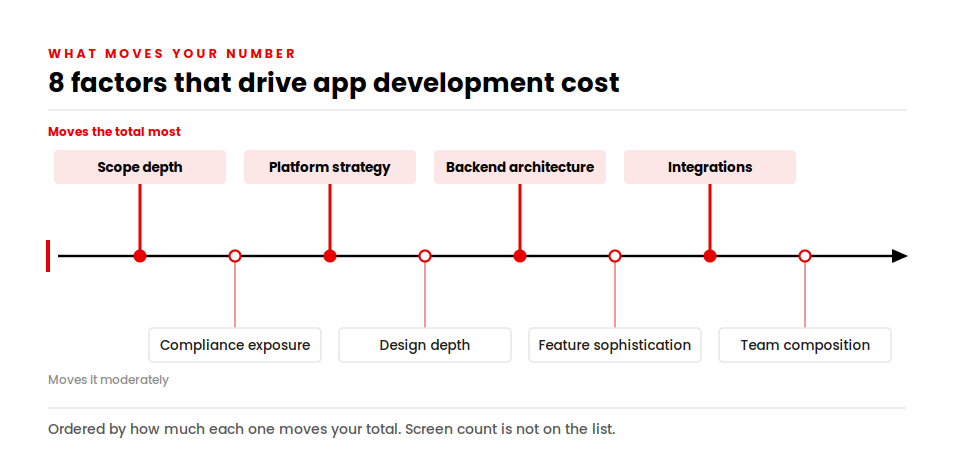
What moves your total is scope depth, platform strategy across native Swift and Kotlin versus React Native or Flutter, backend architecture on AWS, Azure or Firebase, integration count across services like Stripe and Twilio, regulatory exposure under HIPAA, PCI-DSS or GDPR, and the billing model buried in your contract.
This guide breaks the number into line items you can defend to a CFO, prices the years after launch, and answers the thing you are really asking: how long until it pays you back.
Key Takeaways:
- Most apps cost $60,000 to $180,000, with MVPs from $25,000 and regulated builds past $400,000.
- Cost is hours × rate, so ask every vendor for the hour count behind their number.
- The billing model moves your total more than the hourly rate does.
- Maintenance runs 15–25% of the build cost, every year, forever.
- Decide how the app pays back before you commission it.
- Two integrations or fewer, no compliance exposure? An app builder will do.
Average App Development Cost in 2026: A Full Breakdown
To get a starting estimate for your project, use our app development cost calculator, then review the scope factors below to understand what could change your budget.
| Complexity Tier | What It Includes | Average Cost | Timeline |
|---|---|---|---|
| MVP / Simple | Single platform, 5–8 screens, basic authentication, minimal backend, and no third-party complexity | $25,000 – $60,000 | 3 – 5 months |
| Mid-Complexity | Cross-platform development, user accounts, payments, push notifications, admin panel, and 3–5 integrations | $60,000 – $180,000 | 5 – 9 months |
| Complex | Real-time features, multiple user roles, custom algorithms, analytics dashboards, and high-scale requirements | $180,000 – $400,000 | 9 – 15 months |
| Enterprise / Regulated | Multi-platform ecosystem, HIPAA or PCI-DSS requirements, audit logging, SSO, and legacy system integrations | $400,000+ | 12 – 24 months |
The tier you belong in is set by integration depth and compliance exposure, rarely by screen count. I have scoped a 12-screen app at $210,000 and a 40-screen app at $70,000. The 12-screen one talked to three hospital systems and that is exactly what majorly altered the range.
App category shifts the same numbers again, because certain categories carry structural cost that has nothing to do with how the app looks. Understanding different mobile app use cases can help businesses define the right scope, features, and complexity level before estimating development costs.
| App Type | Primary Cost Driver | Typical Range | Timeline |
|---|---|---|---|
| On-demand marketplace | Three products in one: customer app, provider app, and admin console; plus live matching and dispatch logic | $150,000 – $400,000+ | 9 – 15 months |
| E-commerce | Catalog performance at scale, payment and refund flows, and inventory synchronization with existing ERP systems | $70,000 – $250,000 | 5 – 10 months |
| Messaging / Social | Real-time delivery guarantees, media storage, CDN costs, moderation tooling, and encryption requirements | $120,000 – $300,000+ | 8 – 14 months |
The same principle applies to fintech app development cost. A basic financial app might look simple on the surface, but secure transaction processing, KYC/AML workflows, fraud controls, banking or payment integrations, and compliance requirements can push development costs significantly higher.
The on-demand row can sometimes confuse you as a founder. The truth is, when someone tells me they want “an app like Uber,” they are describing three applications and a dispatch engine. Taxi app development cost has to be budgeted with a lot more precision than a simpler app, it carries multiple user-panels and features. The pricing conversation gets much easier once we say that out loud.
Not sure which tier your project sits in?
Answer a few questions about your scope and get a range built around your project instead of an average.
Calculate Your App CostWhy App Development Cost Estimates Vary
Something I get asked constantly: why does every published figure contradict every other one? It is a fair question, and the answer tells you a great deal about how to read any estimate you are handed.
Look at what the main public sources actually say.
| Source | Published Figure | What It Measures | Why It Reads Differently |
|---|---|---|---|
| Business of Apps | Simple: $5,000–$50,000 Medium: $50,000–$120,000 Complex: $120,000–$300,000 |
Aggregated benchmarks pulled from multiple vendor datasets | Includes very small freelance and template-based builds at the bottom, which significantly lowers the starting range. |
| GoodFirms | Simple app: 382–910 hours Advanced app: 915–2,110 hours |
Survey data expressed in development hours rather than dollar estimates | Does not assume an hourly rate, so the final cost changes significantly depending on the market and team you hire. |
| Clutch | Agency rates of roughly $25–$149 per hour | Self-reported hourly rate ranges from listed agencies | Shows rate bands only. It does not indicate how many hours your specific app scope requires. |
| Agency-published guides | Commonly $40,000 to $400,000+ | Delivery pricing from firms building mid-market and enterprise applications | Usually excludes the freelance pricing floor, so the lower end starts much higher. |
None of these are wrong. What makes them deviate is how they measure things.
Hours are the one measure you can apply your own rate to. Take the midpoint of the GoodFirms simple-app range, around 650 hours, and apply a $40 blended rate and you get $26,000. Apply a $120 US rate to the same scope and you get $78,000. Same product, same hours, triple the price.
That single calculation explains most of the confusion in the market. Cost equals hours multiplied by rate, and every published range is quietly making an assumption about one of those two variables.
So when a vendor sends you a total, ask for the hours. If they cannot produce them, they have not scoped the work.
8 Cost Factors That Drive the Numbers for Mobile App Development
These are the eight variables I adjust on every estimate, ordered roughly by how much they move the total.
Scope depth, not screen count
A screen showing static content costs a fraction of a screen that reconciles live data from two external systems. When clients send me a wireframe count, I send back a question about what sits behind each one.
Platform strategy
Building separate native apps in Swift for iOS and Kotlin for Android means two codebases, two test cycles, and double the ongoing maintenance surface. Before choosing that route, teams should also compare the iOS app development cost and Android app development cost against the cost of a shared cross-platform build. A cross-platform build in React Native or Flutter uses one shared codebase and can typically save 30–40% compared with dual native development.
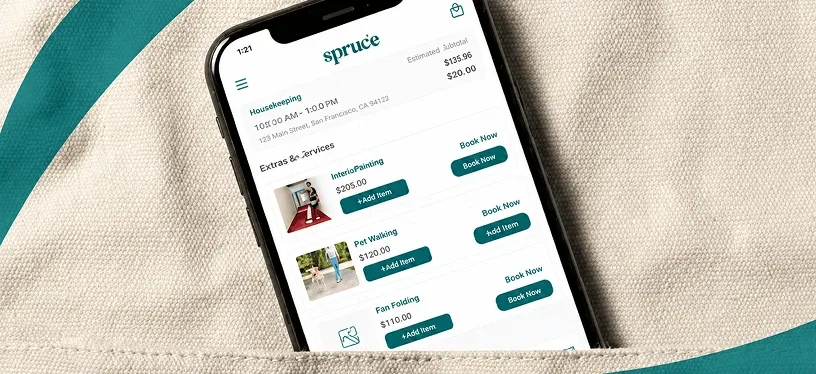
We built Spruce in React Native for exactly that reason, and the client retained 85–95% of native performance while avoiding the cost and complexity of maintaining a second codebase. However, cross-platform is not always the right choice when an app requires deep hardware access, heavy custom animations, or highly platform-specific interactions. Understanding the trade-offs between native and cross-platform development helps teams choose the right approach based on product requirements, budget, and scalability goals.
Backend and cloud architecture
The backend is where your app stores data, enforces rules and talks to everything else. A simple backend with basic authentication and a database runs $10,000–$25,000. One handling real-time processing at scale runs $60,000–$200,000+.
Backend shortcuts are the most expensive mistake I see. Scaling problems never appear at a thousand users. They appear at fifty thousand, when rebuilding costs more than building correctly would have.
Third-party integrations
Every external service you connect to add build time, testing time and an ongoing bill. Payments through Stripe, messaging through Twilio, authentication through Auth0 and analytics through Mixpanel each carry setup cost plus a per-use fee that scales with your traffic.
Industry and compliance exposure
Regulated sectors add a cost layer that generic estimates often leave out. Security architecture and encryption can add $15,000–$40,000, while implementing HIPAA, PCI-DSS, or GDPR controls may add another $10,000–$50,000 plus recurring audit costs.
We built Visionze as a HIPAA-compliant mental health platform, and the compliance requirements represented a clear budget consideration rather than something absorbed quietly during development. A development partner who does not raise compliance during the initial scoping phase may not fully understand the product’s technical and regulatory requirements.
These factors make healthcare app development costs significantly different from standard app projects, especially when security, data privacy, and regulatory workflows are involved.
Design depth
Design decides retention, so it is rarely the place to economize. Here is how app design cost actually distributes on a mid-complexity build.
| Design Stage | Deliverable | Cost Range |
|---|---|---|
| UX Architecture | User flows, information architecture, wireframes | $4,000 – $15,000 |
| UI Design System | Component library, visual screens, states | $8,000 – $35,000 |
| Animation and Micro-interactions | Transitions, loading states, feedback patterns | $3,000 – $25,000 |
| Brand and Iconography | App icon, in-app brand system, store assets | $5,000 – $20,000 |
Feature sophistication
Basic features (profiles, login, content listings) add $10,000–$20,000. Moderate ones (in-app messaging, payments, analytics dashboards) add $20,000–$30,000. Advanced capabilities such as AI recommendations, AR, wearable integrations, or real-time sync add $30,000–$50,000 and upward per capability. Apps that connect with smartwatches, fitness trackers, or medical devices also require additional work around sensor data, Bluetooth communication, and device compatibility. A deeper look at wearable app development helps teams understand these additional cost factors.
Team composition
When you hire a mobile app development company, you are paying for a team, not a developer. A realistic mid-complexity build needs engineers, a designer, a QA specialist, a project manager and some architecture oversight. When a quote looks unusually low, the missing roles are usually the reason.
App Development Cost Breakdown by Stage: Where the Money Actually Goes
When a CFO asks me to justify a number, this is the table I bring. Costs accumulate in phases, each with its own risk profile, and underfunding any single phase reliably produces rework later.
| Stage | % of Budget | Cost Range (Mid-Complexity Build) | Duration |
|---|---|---|---|
| Discovery and Requirements | 10 – 15% | $7,000 – $25,000 | 2 – 4 weeks |
| UX and UI Design | 20 – 25% | $15,000 – $60,000 | 4 – 8 weeks |
| Backend Development | 20 – 30% | $25,000 – $60,000 | 8 – 14 weeks |
| Frontend / App Development | 25 – 35% | $50,000 – $120,000 | 10 – 16 weeks |
| QA and Testing | 15 – 20% | $15,000 – $45,000 | Runs alongside build |
| Launch and Store Deployment | 5 – 10% | $5,000 – $15,000 | 2 – 4 weeks |
| Year-One Maintenance | 15 – 25% of build cost | $18,000 – $45,000 | Ongoing |
Two lines in that table are the ones people try to cut, and both are false economies.
Discovery gets cut because it produces documents rather than software. I have watched teams save 30–40% of their downstream budget by validating assumptions during discovery instead of discovering them mid-build, when every correction touches code that already exists.
QA gets cut because it looks like insurance. Skipping it moves the cost rather than removing it, into churn, one-star reviews and emergency patches that cost far more than the testing would have.
App Developer Hourly Rates by Country: What It Costs to Hire in 2026
Geography sets your rate, and rate is one of the two variables in the cost equation. Here is what the market looks like in 2026.
| Region | Junior | Mid-level | Senior |
|---|---|---|---|
| United States / Canada | $65 – $90/hr | $100 – $130/hr | $130 – $150+/hr |
| United Kingdom | $60 – $80/hr | $85 – $110/hr | $100 – $120/hr |
| Western Europe | $50 – $70/hr | $70 – $90/hr | $80 – $100/hr |
| Gulf / UAE and Saudi Arabia | $45 – $70/hr | $65 – $95/hr | $85 – $120/hr |
| Eastern Europe | $25 – $40/hr | $35 – $55/hr | $45 – $70/hr |
| Latin America | $20 – $35/hr | $30 – $50/hr | $40 – $60/hr |
| South and Southeast Asia | $15 – $25/hr | $20 – $40/hr | $35 – $55/hr |
The gap between a senior US engineer and a senior Eastern European engineer is roughly two to three times per hour. Whether that gap is worth paying depends on your product, not on a general preference for one region.
Rate is only half the picture. How you engage a team changes your total as much as where they sit.
| Engagement Model | Rate Range | Best For | Risk Profile | True Cost Context |
|---|---|---|---|---|
| Freelancer | $50 – $300/hr | Bounded prototypes, single features, short specialist work | High — single point of failure, IP exposure, no continuity | Cheapest upfront option, but carries higher rework and handover risk |
| Agency | $75 – $250/hr | Full production builds with a real deadline | Medium — accountability structures exist, but overhead is real | Higher upfront investment, but more predictable delivery and support |
| Dedicated Offshore Team | $30 – $80/hr | Ongoing product development and scaling | Low to medium — if properly vetted and managed | Strongest long-term cost per output, but requires internal technical oversight |
| In-house | $150,000 – $200,000/year fully loaded | Core product roles at Series A and beyond | Low — full alignment and retention | Highest total cost, but creates the strongest institutional knowledge |
One condition on the dedicated-team row. That model works when you have an internal technical lead or CTO who can evaluate output quality. A dedicated development team with no internal technical counterpart becomes a risk rather than a solution.
If you are budgeting per hour rather than per project, the mid-level band in your chosen region multiplied by the GoodFirms hour count for your complexity tier will land you close enough to start a real conversation.
The Quote Anatomy: What You Are Actually Paying For
This is the section I wish every buyer read before their first vendor call, because the billing model in your contract moves your final total more than the hourly rate inside it.
There are three structures in common use.
Time and material. You pay for hours logged. It suits evolving scope and iterative product work, and it drifts badly without milestone discipline and a named person enforcing scope.
Fixed price. You agree a scope and a number. The risk transfers to the vendor, so any competent vendor pads the quote to absorb unknowns, and every subsequent change becomes a priced change order. It works when requirements are genuinely complete before work starts, which for complex products is rare.
Retainer or dedicated engagement. You buy capacity at a monthly rate, typically $3,000–$8,000 per developer depending on seniority and region. It gives predictability and deep product familiarity without employment overhead.
| Billing Model | Budget Predictability | Scope Flexibility | Where the Risk Sits |
|---|---|---|---|
| Time and Material | Medium | High | With you |
| Fixed Price | High | Low | With the vendor, priced into the quote |
| Retainer / Dedicated | High | Medium | Shared |
The Quote Anatomy Checklist
When two quotes differ wildly, the cause is almost always something absent from the cheaper one. Ask every vendor to price these nine lines separately, in this order, and compare line by line rather than comparing totals.
A related habit worth building: challenge any line item whose label could mean three different things. “User management” can mean a login screen, or it can mean roles, permissions, invitations, audit trails and account recovery. Two vendors reading the same phrase differently is one of the most common reasons quotes diverge, and the gap only surfaces once the build is underway.
- Discovery and requirements. If it is missing, you are paying for it later as rework.
- UX and UI design. Confirm whether a design system is included or only screens.
- Backend and API development. Ask what happens at 10x your expected load.
- Frontend build, per platform. Confirm exactly which platforms the number covers.
- Third-party integrations, itemised. Each integration named, with its recurring cost stated.
- QA and testing. Manual, automated, performance and security should appear as separate lines.
- DevOps and deployment. CI/CD pipeline setup, environments, store submission.
- Project management. If nobody is being paid to run the project, you are running it.
- Post-launch support window. How many weeks of fixes are included before maintenance billing starts.
A vendor who cannot produce those nine lines has given you a guess with a decimal point.
What change actually costs
Scope will move. The cost of moving it depends entirely on when.
A change during discovery costs a conversation and a document revision. The same change during design costs rework of flows and screens. After the build has started, it touches code, tests and sometimes architecture. Post-launch, it touches all of that plus a migration path for existing users and data.
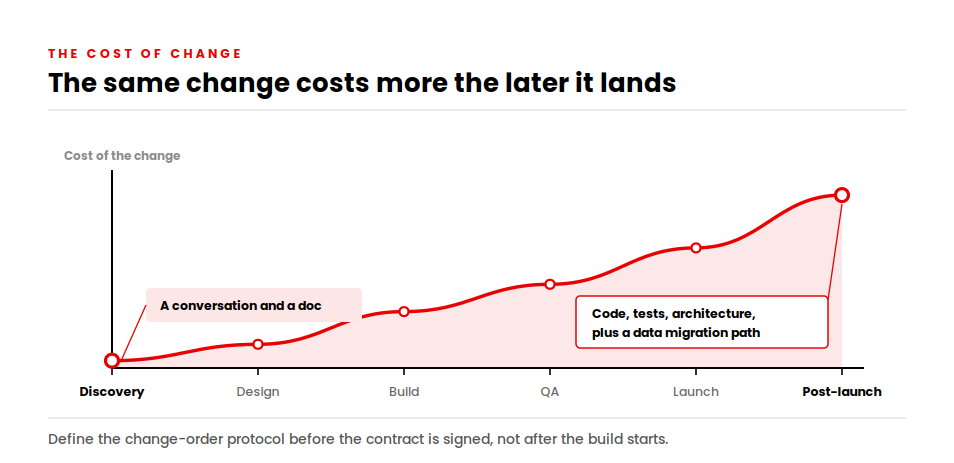
So define the change-order protocol in writing before the contract is signed: how a request gets priced, who approves it, and how it gets documented. Projects without that protocol turn every feature conversation into a negotiation.
The App Maintenance Cost and Ongoing Expenses After Launch
Your build budget buys you version one. Owning the product is a separate, recurring line that surprises more first-time founders than anything else on this page.
| Ongoing Cost | Typical Annual Figure |
|---|---|
| Maintenance (bug fixes, OS compatibility, security patches) | 15% – 25% of original build cost |
| Cloud hosting and infrastructure | $2,400 – $60,000 |
| CDN and media delivery | $6,000 – $36,000 |
| Third-party service and API fees | $5,000 – $50,000+ |
| Apple Developer Program | $99/year |
| Google Play Console | $25 one-time fee |
| Security audits and penetration testing | $5,000 – $20,000 per engagement |
It is important to take the app maintenance cost seriously, because it compounds. A $120,000 app carries $18,000 to $30,000 of annual maintenance, which makes your real year-one figure closer to $145,000. Every year after that, the same 15–25% applies to a codebase that keeps growing.
Two platform-level costs deserve naming. Apple and Google both release major OS versions annually, and each one requires compatibility work whether or not you shipped a single new feature. Cloud costs scale with usage, so success itself raises your bill.
Then there is user acquisition, which is usually the largest post-launch line and the one least often budgeted. Cost per install currently runs about $1.50–$4.00 on Android and $1.50–$3.50 on iOS, with North America at the higher end.
I say a version of this on most calls: do not spend $150,000 building something and leave nothing to launch it with. A product nobody can find performs identically to a product that was never built.
Is Owning an App Profitable? A Break-Even Model for Your Build
Cost is only half a decision. The other half is return, and it gets far less attention than it deserves. We’ve written separately about the benefits of mobile apps for businesses; this section is about putting numbers on them. The profitability potential exists within a much larger mobile ecosystem. Market growth, user adoption, and changing consumer behavior all influence whether an app can generate measurable returns. Understanding global mobile app development market statistics helps businesses evaluate the broader opportunity before measuring potential ROI.
Here is the model I walk executives through. It is deliberately simple, because a simple model people actually complete beats a sophisticated one they abandon.
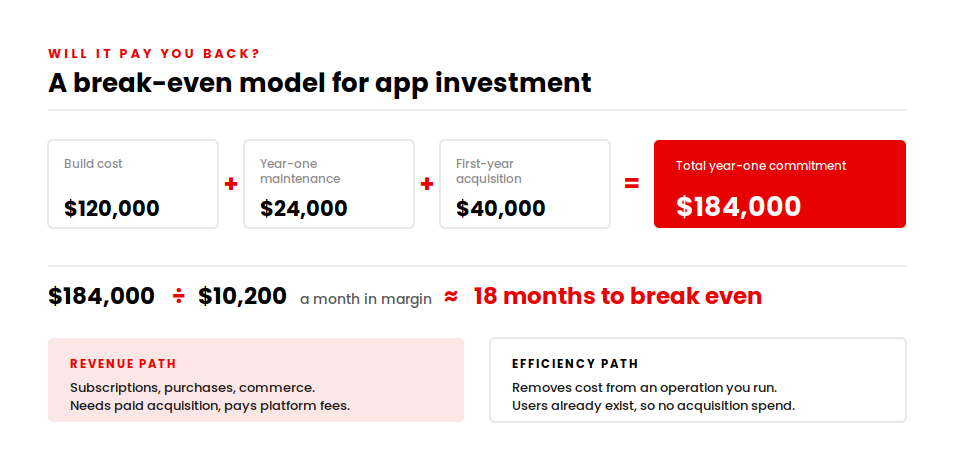
Total year-one cost = build cost + year-one maintenance + user acquisition spend
Monthly contribution = (monthly active users × revenue or cost saving per user) − monthly running cost
Months to break even = total year-one cost ÷ monthly contribution
That number is either obviously achievable or obviously not, and either answer is useful. What you want to avoid is not knowing.
The two paths to payback
Apps recover their cost in one of two ways, and the distinction changes your entire budget.
Revenue apps earn directly through subscriptions, in-app purchases or commerce. They need paid acquisition, and platform fees apply. Apple and Google take 15% on the first $1M of annual earnings and 30% above it. Your monetization model also changes your build cost: subscriptions require billing, entitlement and proration logic; freemium requires analytics and lifecycle messaging infrastructure.
Efficiency apps pay back by removing cost or friction from an operation you already run. They rarely need paid acquisition because the users already exist, which makes their payback maths considerably kinder.
Our work with the Nokia Al-Saudia Training Centre is a clear example of the second path. Their training delivery and certification management ran across fragmented systems with heavy manual handling. After we rebuilt the platform, they onboarded more than 10,000 learners and cut manual enrollment processing time by 35%.
That 35% is the payback. No acquisition spend, no platform fee, just administrative hours removed from a process that runs continuously.
When the return is engagement rather than revenue
Some products are judged on reach. ParentPass, built for The Miles Foundation, connects families to community resources, parenting content and local events, with a focus on underserved populations.
We built it in React Native on a .NET backend across Azure and Google Cloud, with a recommendation engine personalizing content by family need, location and child age. Since launch it has reached over 17,000 users, including 12,439 registered members, with more than 7,000 local events listed.
For a mission-driven product, those adoption numbers are the return. The budgeting lesson holds either way: decide what your payback metric is before you commission the build, because it changes which features are worth funding.
Custom App Development vs App Builders: When Not to Pay for Custom
I will argue against my own service here, because the alternative is real and sometimes correct.
App builders and no-code platforms have improved considerably. For a genuinely simple product, one of them will get you live for a few thousand dollars in a few weeks, and paying an agency for that work is a waste of your money.
The honest question is where the line sits. These are the four gates I use.
Gate 1 — Integration depth. Connecting to one or two mainstream services through a standard connector is comfortable builder territory. Once you need three or more systems, custom API work, or anything talking to a legacy internal platform, builders stop being viable.
Gate 2 — Compliance exposure. If you handle protected health information under HIPAA, card data under PCI-DSS, or need auditable access logs, you need control over your data layer and infrastructure. Most builder platforms cannot give you that.
Gate 3 — Expected concurrency. Builders handle modest traffic well. Real-time features at scale, live location, or high concurrent write volume will hit a platform ceiling you cannot engineer around.
Gate 4 — Is the app the business? If the app is a channel supporting a business that already works, a builder may serve you for years. If the app is the product, you need to own the codebase, the roadmap and the performance characteristics.
Two or more gates say yes, custom development is the right call. Zero or one, start with a builder and revisit in twelve months.
For a concrete sense of where the line falls, one of our builds scans a pool’s surroundings in augmented reality, stitches multiple images into a single view, and uses AI and geometric algorithms to plot coping materials onto a three-dimensional space before the customer orders. That runs on native iOS and Android with a .NET backend and Python microservices. No builder platform reaches that. Projects combining AI capabilities, custom backend infrastructure, and advanced mobile experiences require a different budgeting approach because development costs depend heavily on architecture, data requirements, and ongoing AI operations. Our guide on AI app development cost breaks down the factors that influence pricing for these types of products.
Meanwhile a straightforward booking or catalog app with one payment integration and a few hundred monthly users genuinely does not need us. Telling people that costs us the occasional project and saves them from a bad one.
How to Reduce Your App Development Cost without Damaging the Product
Cost optimization is a scoping problem. Cheaper engineers rarely fix expensive decisions.
Fund one measurable outcome first. Your first release should prove exactly one thing: revenue, retention, and operational saving or risk reduction. Teams that hold that line typically cut initial spend by 40–60% without compromising what they build later.
Our approach to MVP development is built around that constraint.
Phase the build deliberately. Discovery, then MVP, then version two. Each phase gives you real usage data before you commit the next tranche of budget, which beats any estimate.
Use cross-platform where it fits. Single-codebase builds save 30–40% against dual native when UI parity is acceptable and hardware access is light. They fit poorly for hardware-intensive apps and heavy custom animation.
Reuse generic components, build the differentiators. Standard elements such as authentication, contact screens and navigation patterns can be reused. Build the features that make your product distinct from scratch, because those are the ones customers choose you for.
Bring QA in from day one. Involving QA at requirements stage rather than after the build catches specification problems while they are still cheap to fix.
Split ownership from execution. Most mature teams keep product ownership, architecture decisions and compliance leadership close to the business, then place delivery capacity wherever the economics are strongest. That structure gives you cost control without losing product direction.
How AppVerticals Estimates Your App Development Cost
We start with hours, not a headline number.
Our estimation process runs discovery first, converts requirements into modules, sizes each module in hours, then applies a blended rate for the team structure the project actually needs. You see the module-level hour count, which means you can challenge the scope rather than negotiating a total that has no visible components.
That approach also handles the situation we see more often than we would like: a project that has already gone wrong somewhere else. Lulo Freight, a Texas-based freight logistics platform, came to us after a previous development partner could not complete the work to the agreed scope.
We analysed what existed, identified the gaps against their objectives, and finished the platform: real-time shipment tracking, instant transparent quoting for shippers, a load board matching carriers to freight by fleet capacity, and payment and driver management on the carrier side. It runs on Laravel and React Native with MySQL, Firebase and AWS.
Rescue work is the most expensive way to build software. Everything gets paid for twice, and the second team inherits decisions it would not have made. The scoping discipline that prevents it costs a fraction of what it saves.
Conclusion
The number you have been quoted is not the decision in front of you. What matters is whether the scope behind that number is the smallest thing that proves your business case, and whether the contract behind it protects you when the scope moves. It will move.
A $60,000 build that ships the wrong product costs more than a $160,000 build that ships the right one. And a low hourly rate attached to a vague statement of work is the most expensive line item in software.
So price the scope rather than the app. Ask every vendor for the same nine line items in the same order and see which estimate survives the comparison. The one that can show you its hours is the one worth talking to.
Price your app build line by line
Scoping, architecture, design, build and post-launch support for iOS, Android and cross-platform products, with module-level hour estimates you can challenge.
Explore our mobile app development services →
Read our mobile app development guide to get a detailed idea of where is your budget meant to be spend.