













 ChatGPT
 Perplexity
 Claude
 Google AI
App design costs between $2,500 and $60,000 in 2026. The range is wide because design is not sold as a product with a price. It is a share of a build, typically 10–15% of the total, which means the honest answer to what design costs starts with what the app costs.
That reframe matters more than any number on this page. When a quote arrives with a flat design fee attached to no particular build, the fee is a guess dressed as a price, and the gap between it and the real cost gets discovered later, in rework.
What app design actually costs in 2026
Design spend tracks the tier of product being built. Against AppVerticals’ current build tiers, and the 10–15% share that UI/UX design typically takes of a total budget, the design numbers land like this.
| Build tier | Total build | UI/UX design (10–15%) | Discovery and scoping (5–10%) | Design phase total |
|---|---|---|---|---|
| Scoped MVP | $25,000–$60,000 | $2,500–$9,000 | $1,250–$6,000 | $3,750–$15,000 |
| Mid-complexity | $60,000–$150,000 | $6,000–$22,500 | $3,000–$15,000 | $9,000–$37,500 |
| Enterprise | $150,000–$400,000+ | $15,000–$60,000 | $7,500–$40,000 | $22,500–$100,000 |
The discovery column belongs in this conversation even though it is usually budgeted separately. Discovery is where user research, competitive review and information architecture happen, and those are design activities whether or not a designer bills for them. Teams that strip discovery out to make the design number look smaller pay for it in the first round of revisions.
A few things follow from the table.
An MVP design phase under $3,750 is possible, but what gets cut is almost always the same three things: states other than the happy path, accessibility, and the design system. All three come back as engineering cost.
The mid-complexity band is where most funded products sit, and where the widest quote variance appears. A $60,000 build and a $150,000 build are both described as mid-complexity by the people selling them, but their design phases differ by a factor of nearly four.
Enterprise design budgets look alarming until you separate them into role count. A $60,000 design phase on a $400,000 platform is not one expensive app. It is usually four or five interfaces that have to stay coherent with each other.
For the total picture these percentages are drawn from, see what a full app development costs. The $25,000 floor is not an arbitrary starting point either; it is the level at which MVP budgets start at $25,000 become capable of producing something a real user can use.
Turn your feature list into a number
Answer a few questions about platform, scope and roles, and price your own design phase before you brief a single agency.
Calculate app design costWhy design is priced as a share of the build
A flat design quote assumes the design work can be finished before anyone knows what the product does. That assumption holds for a brochure site. It does not hold for software.
Design on a real build stays open until the last integration lands. A payment provider that returns a decline code nobody planned for needs a screen. A permission model that gains a fourth tier needs a navigation rethink. The design budget is a share of the build because design work is generated by the build, continuously, not delivered to it once at the start.
This is why the quote that looks cheapest often is not. Three patterns to watch for.
A design fee quoted before scope exists. If nobody has asked how many user roles the product has, the number is a placeholder. It will hold until the second sprint.
Design excluded from the build quote entirely. Some vendors quote engineering only and expect the client to supply finished screens. That is legitimate if you have a design team. If you do not, you have not saved 12% of budget, you have moved it somewhere with less accountability.
A design fee with no revision count. Revisions are the single most common overrun in the design phase. A quote that does not name a number is a quote that intends to bill for them.
The useful question to ask a vendor is not what design costs. It is what percentage of this build is design, and what happens to that percentage if the role count changes.
What the design budget buys, stage by stage
Design is seven distinct activities, and buyers routinely believe they are paying for the last one only.
| Stage | What happens | Share of design budget | What you must supply |
|---|---|---|---|
| Discovery and research | User interviews, competitive review, assumption mapping | 10–15% | Access to real users, business goals, priority order |
| Information architecture | Navigation model, content hierarchy, permission structure | 10% | Every user role, named, with what each may and may not do |
| User flows | Task paths, decision points, error and recovery routes | 10–15% | The workflows that actually matter commercially |
| Wireframes | Low-fidelity screen structure, layout logic, state coverage | 15–20% | Fast feedback; this is the cheapest place to change your mind |
| UI design | Visual design, typography, colour, iconography, motion | 25–30% | Brand assets, or budget to create them |
| Design system | Reusable components, tokens, rules for future screens | 10–15% | A decision on whether you want one; skipping it is legitimate on a throwaway MVP |
| Prototype and handoff | Clickable prototype, specs, developer-ready files | 10% | Engineering availability to review before build starts |
The two stages buyers most often try to cut are wireframes and the design system, and they are the two that cost the most to skip.
Cutting wireframes means design decisions get made in high fidelity, where changing a layout costs four times what it costs in grey boxes. Cutting the design system means every new screen after launch is designed from scratch, which turns a one-off saving into a permanent tax on every future release.
Does an app icon have its own cost?
Usually not a separate line. An app icon is normally folded into UI design, and on a standard engagement it consumes a few hours across two or three concepts. Where it does become a line item is when the icon requires original brand work rather than an application of existing brand assets, in which case it belongs in a branding scope, not a product design scope, and runs $500 to $3,000 depending on the studio.
The practical point is that an icon is one artboard among hundreds. If a design quote itemises the icon, look at whether it also itemises error states, because one of those two things drives real cost and it is not the icon.
Accessibility is not an add-on
WCAG 2.2 compliance designed in from the start adds roughly 5% to a design phase. Retrofitted after launch, it routinely costs more than the original UI design did, because contrast, focus order, target sizes and semantic structure are not surface properties. They are consequences of layout decisions made months earlier.
If the product serves healthcare, education, government or any enterprise buyer with a procurement checklist, accessibility is not optional and pricing it as optional is how projects lose deals at the security review.
If you would rather talk this through against a real feature list than a table, our UI/UX design team scopes design phases as part of full builds and as standalone engagements.
The real driver of mobile app design cost are roles and states, not screens
Every design quote you receive will be built on a screen count. Every design phase that overruns, overruns because screens were the wrong unit.
A buyer counts screens. A designer draws states. Those two numbers are not close to each other.
Take a single screen, a bookings list. The buyer counts one. The designer draws the empty state before any booking exists, the loading state, the populated state, the state with enough rows to need pagination, the error state when the request fails, the offline state, and the state where the user’s permissions hide two of the columns. That is seven artboards from one screen, and none of them are optional if the product is going to survive contact with real users.
Now multiply by roles. This is where quotes break.
| Product shape | Screens quoted | Roles | Approximate artboards | Design phase reality |
|---|---|---|---|---|
| Single-role consumer app | 12 | 1 | 40–60 | Predictable; screen count is a usable proxy |
| Two-sided marketplace | 12 per side | 2 | 100–140 | Two navigation models that must feel like one product |
| Multi-role operational platform | 12 per role | 4–5 | 250–400 | Five permission models, five sets of edge cases, one design system holding it together |
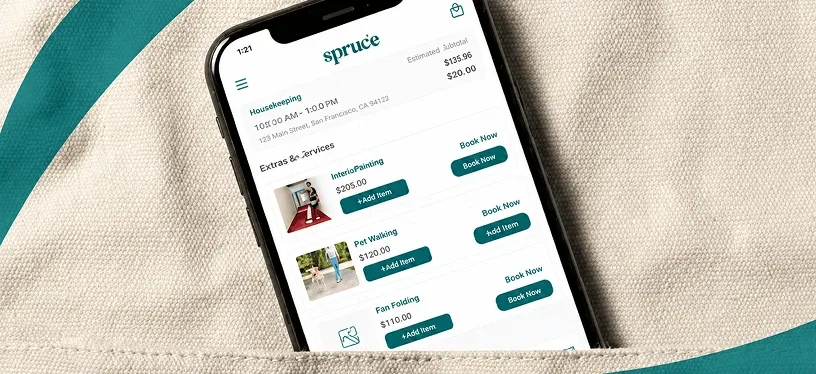
The third row is not a hypothetical. When AppVerticals rebuilt the Spruce platform rebuild, a home and property services business, the product carried five distinct roles: admin, resident, service provider, service pro and property manager. A buyer would describe that product in one sentence. The design work was proportional to the five, not to the sentence. The platform now runs 6,477 properties and more than 685,000 onboarded customers across 67 service providers, and it needed five coherent interfaces to get there.
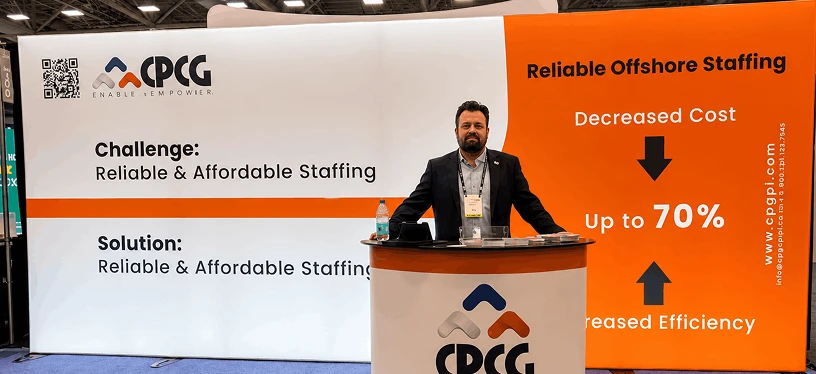
The same pattern shows in CPCG’s remote kiosk operations platform, where the build resolved into four role-specific portals, each with scoped permissions: on-screen customer representative, store manager, organisation admin and super admin. Same principle, one role fewer.
So when you are pressure-testing a design quote, the question that separates a real estimate from a hopeful one is this: how many roles did you assume, and how many states per screen did you price?
A vendor who answers with a number has scoped the work. A vendor who answers with a range has not.
[Zaid Tirmizi quote to be supplied: how design estimates are built, specifically on separating role count from screen count when scoping. Pending, see brief item 4.]
Cross-platform saves build cost, not design cost
One correction worth making, because it catches founders regularly. Choosing a shared codebase reduces engineering cost substantially. On Spruce, React Native delivered savings of 30–40% against building separate native apps, while retaining 85–95% of native performance.
It does not reduce design cost by anything like the same proportion. The flows, the states, the permission models and the design system are identical work regardless of whether one codebase or two consume them. Expect a shared codebase to trim design effort by roughly the cost of platform-specific component variants, which is real but modest.
iPhone, Android and cross-platform design budgets
Platform choice moves the design number less than most buyers expect, and it moves it for a reason that has nothing to do with the platforms being harder or easier.
How much does it cost to design an app for iPhone?
An iPhone-only design phase is the cheapest of the three options, usually at the lower end of each tier band, because the device matrix is narrow and Apple’s Human Interface Guidelines settle a large number of interaction decisions before a designer has to make them. On a scoped MVP that means roughly $2,500 to $7,000; on a mid-complexity product, $6,000 to $18,000.
The saving is real but small, and it evaporates the moment the product also needs iPad layouts, which is a separate set of artboards rather than a resize. For the full iOS budget picture, see iPhone build budgets in detail.
How much does it cost to design an Android app?
Android design costs slightly more than iOS at the same scope, typically 5–10% more within the same tier. The driver is screen density and form factor variation rather than anything about Material Design 3, which is a well-specified system that helps designers move quickly.
What actually adds cost is that Android products more often need to work well on low-end hardware and in poor connectivity, and designing genuinely usable offline and degraded states is design work that iOS-first products frequently postpone. The platform-level cost picture sits in Android cost tiers.
Designing for both
Designing for both platforms does not double the design cost. It adds roughly 15–25% over single-platform design, covering platform-specific navigation patterns, component variants and two rounds of device testing.
The mistake is designing once and letting engineering improvise the second platform. That produces an app that feels borrowed on whichever platform came second, and it costs more to correct after launch than the 15–25% would have cost up front.
What does mobile app designers charge, by region and engagement model
Hourly rate is the least useful number in this article, and it is the one most buyers anchor on first.
| Region | Junior | Mid-level | Senior |
|---|---|---|---|
| USA and Canada | $60–$90/hr | $90–$140/hr | $130–$200/hr |
| Western Europe | $45–$70/hr | $70–$110/hr | $100–$150/hr |
| Eastern Europe | $30–$45/hr | $45–$70/hr | $65–$95/hr |
| India and Southeast Asia | $18–$30/hr | $30–$50/hr | $45–$70/hr |
| Latin America | $25–$40/hr | $40–$60/hr | $55–$85/hr |
A fuller geographic breakdown across the whole build, not just design, sits in rates by country.
The reason rate is a poor guide is that design hours are not fungible. A senior designer who resolves a navigation model in three hours has done work a junior cannot do in thirty, and the junior’s version will be re-drawn during build. Rate arbitrage works on production work. It does not work on structural decisions.
Which engagement model fits
| Model | Typical cost for a mid-complexity design phase | Works when | Breaks when |
|---|---|---|---|
| Freelance designer | $6,000–$15,000 | Single role, clear scope, you have a product owner who can direct design | Roles multiply, or the designer becomes unavailable mid-build |
| Design studio | $20,000–$45,000 | Brand matters commercially and you need a design system that outlives the project | Engineering is elsewhere and nobody owns the handoff |
| In-house designer | $95,000–$140,000/yr plus tooling | You will ship continuously for years | You need a design phase now and a hire takes four months |
| Build partner, design included | 10–15% of build | You want one accountable party from flows to shipped code | You already have a design team and only need engineering |
The in-house row is the one worth reading carefully, because it is the comparison most often made badly. A $120,000 salary is not $120,000 of design capacity. Add employer costs, tooling, recruitment and ramp-up, and a first-year in-house designer typically lands between $150,000 and $180,000 all-in. Against a mid-complexity design phase of $9,000 to $37,500, hiring makes sense only if the design work continues well past launch, which for a genuine product it usually does, and for a single validating MVP it usually does not.
How much does it cost to redesign an app?
Redesign costs between 60% and 110% of designing the same product new. Buyers expect a discount for the work already done. That discount rarely exists, and understanding why prevents a badly scoped project.
A new design starts from a blank file and a set of goals. A redesign starts from a live product with users who have learned its habits, data structures that constrain what screens can show, and a backlog of decisions nobody can now explain. The design work includes an audit phase that new design does not require at all.
| Redesign type | Cost relative to new design | What is actually happening |
|---|---|---|
| Visual refresh | 25–40% | New colour, typography and components over unchanged flows and structure |
| UX redesign | 60–80% | Flows and information architecture rebuilt; visual layer partly reused |
| Platform re-architecture | 90–110% | Roles, permissions and data model change; the old design informs little |
The third row is the one people walk into unprepared. When the underlying system changes, a redesign is a new design that also has to carry a migration path for existing users, and it costs more than starting clean would have.
Both of the projects cited earlier were this kind. Spruce arrived with a working multi-platform product across five roles and a legacy architecture that had stopped absorbing new features; the engagement was a system-wide redesign rather than a reskin. Nokia Al-Saudia’s portal redesign was the same shape, rebuilding a fragmented training platform into a role-aware portal serving on-site, online, virtual and self-study delivery, with multilingual and market localisation support. More than 10,000 learners have since been onboarded, and manual enrolment processing time fell by 35%.
That localisation point deserves its own warning. Designing for multiple languages is not a translation task handed to someone at the end. German strings run roughly 30% longer than English, Arabic reverses layout direction entirely, and both facts change component design. Scoped up front, localisation adds around 10% to a design phase. Discovered after the UI is finished, it means redrawing it.
What design spend buys back
The question underneath most searches for design cost is whether the spend returns anything. It does, in three places, and only one of them is the one people expect.
Rework avoided. This is the largest return and the least visible. A design decision changed during wireframing costs a few hours. The same decision changed after the screen is built, tested and integrated costs days across three people. A design phase that resolves structure before code starts is not an expense ahead of engineering; it is a discount on engineering.
Support load. Interfaces that require explanation generate tickets. Every support conversation about where a button is has a recurring cost that the design budget was a one-off chance to remove.
Retention and conversion. The return everybody cites first is real but the hardest to attribute, because retention moves for many reasons at once. Treat it as an upside rather than the business case.
A useful sense of scale: a four-month build to launch took The Obituary App from concept to a live product with more than 10,000 downloads, over 100 obituaries posted and claimed daily, coverage across 10+ US cities, and search returning in roughly 0.3 seconds. Four months is not a long time to reach that, and the reason a timeline like that holds is that the flows were settled before the build began.
On whether an app is worth owning at all, the honest answer is that the design budget is rarely what decides it. Products fail from building the wrong thing far more often than from designing the right thing badly. Design spend reduces the cost of being wrong; it does not make a weak product idea work.
Five things that quietly drives an app design cost
| Trigger | What it adds | How to prevent it |
|---|---|---|
| Unbounded revision rounds | 15–30% of the design phase | Name a number in the contract. Three rounds per stage is normal, and “unlimited” always has a hidden price |
| Undefined states | 20–40% of artboard count | List every state per screen at scoping: empty, loading, error, offline, permission-limited |
| Brand assets arriving late | 10–20%, plus schedule slip | Supply logo, type, colour and tone of voice before UI design starts, or budget for brand work explicitly |
| Accessibility retrofitted | More than the original UI design cost | Design to WCAG 2.2 from the wireframe stage; it adds about 5% up front |
| Localisation discovered late | Redraw of affected components | Decide on languages at IA stage, not after UI sign-off |
Four of those five are scoping failures on the buyer’s side rather than vendor behaviour, which is the useful thing to notice. The lever on design cost that a buyer actually controls is the quality of the brief.
How to brief a designer so the quote holds
Bring these eight things and the number you receive will survive the project. Bring fewer and the quote is a starting position.
| Bring this | Why it changes the price |
|---|---|
| Every user role, named | The single largest cost multiplier in the design phase |
| What each role may and may not do | Permission variants are screens, and they are invisible until someone lists them |
| Screens with their states, not just screen names | Turns a screen count into an artboard count, which is what is actually being priced |
| Brand assets, or a decision that there are none | Determines whether this is product design or product design plus branding |
| Target platforms, and whether tablet is included | iPad and Android tablet layouts are separate work, not resizes |
| Languages at launch and within 12 months | Localisation is a structural constraint, not a late-stage task |
| Accessibility requirements, including any procurement standard | Moves compliance from retrofit to design-in, at a fifth of the cost |
| Who signs off, and how fast | Approval latency is the most common cause of design phase overrun |
If a vendor does not ask for most of this list before quoting, the quote was not built on your product. It was built on an average.
Conclusion
App design costs $2,500 to $60,000, and the spread inside that range is explained almost entirely by two variables: the tier of build the design serves, and the number of user roles it has to serve them across. Screen count, the number most quotes are built on, predicts very little.
The practical move for anyone about to request quotes is to spend an afternoon writing down every role, every permission difference, and every state per screen. That document will change the numbers you receive more than any negotiation will.
Scope your design phase against a real feature list
Flows, wireframes, design systems and developer-ready handoff, priced as part of a full build or as a standalone engagement.
Explore our mobile app design services