
About Us
About Us
We’re a future-focused tech partner working with some of the world’s top enterprises. At AppVerticals, we design solutions that drive growth and reimagine digital experiences.

Services
Software Development
Mobile App Development
Web Design & Development
Tell us what you're looking for, and we'll tailor a solution based on your business needs.
Talk to Experts
Health Tech

EdTech

Logistics

Real Estate

Ecommerce

Sports

Fintech

Travel

Restaurant

Automotive
HIPAA-compliant digital solutions for hospitals, clinics, and healthtech startups driving better patient outcomes.
What we do:
Scalable learning platforms for schools, universities, and EdTech startups transforming education delivery.
What we do:
Real-time tracking and automation solutions for freight companies, warehouses, and delivery services.
What we do:
PropTech platforms for brokerages, property managers, and real estate marketplaces are streamlining operations.
What we do:
High-converting commerce platforms for D2C brands, retailers, and online marketplaces are driving revenue growth.
What we do:
Fan engagement platforms for sports teams, leagues, and betting operators are creating immersive experiences.
What we do:
PCI-DSS compliant solutions for digital banks, payment platforms, and InsurTech companies, ensuring security.
What we do:
Booking and hospitality solutions for OTAs, hotels, and tourism platforms, enhancing traveler experiences.
What we do:
Online ordering and operations software for restaurants, cloud kitchens, and food delivery platforms.
What we do:
Connected vehicle platforms for automotive OEMs, dealerships, and mobility providers are accelerating innovation.
What we do:
Our Odoo implementation brings financial discipline, operational visibility, and process control across departments. From accounting automation to manufacturing workflows, we design ERP systems that reduce operational leakage and provide real-time decision clarity.
We use Sitecore to drive measurable revenue growth through intelligent personalization and behavior-driven content delivery. By aligning marketing automation, data orchestration, and omnichannel engagement, we help brands turn digital touchpoints into retention engines.
We architect AWS environments that stay stable under scale, traffic spikes, and compliance pressure. From secure cloud migrations to CI/CD automation and cost governance, we engineer cloud foundations that protect performance while enabling rapid product evolution.
We implement Dynamics 365 to align systems with actual business operations, bringing clarity, control, and accountability across CRM, ERP, and service functions. From sales to finance, configurations eliminate inefficiencies and enable confident, real-time decisions.
Tell us what you're looking for, and we'll tailor a solution based on your business needs.
Talk to ExpertsPortfolio
AppVerticals was featured in Inc. 5000 as
America’s Fastest Growing Tech Company
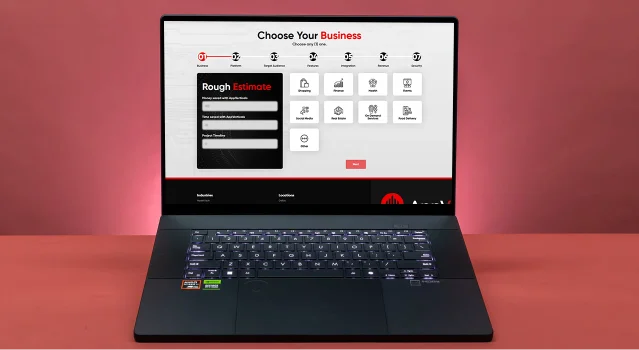
See what it might cost to bring your app idea to life. Our calculator gives you a quick, simple estimate based on what you need.
 verified expert
Senior Content Writer — Mobile & Software Development, AI
Zainab helps tech brands sound more human. She takes app ideas, features, and updates and turns them into content people actually want to read. Whether it’s for a launch, a campaign, or just making things...
See Full Bio22 minutes read
The mobile app development market has experienced exponential growth over the past decade, and 2026 marks a pivotal year for businesses looking to leverage this transformation. If you’ve been on the fence about entering the mobile-first space, now is the time to act.
It’s no longer a question of if mobile apps are a worthwhile investment, it’s about how quickly you can take your business mobile.
Here’s why 2026 is the ideal time to invest:
If you’re still on the fence about mobile apps, it’s time to move quickly. The mobile-first future is already here, how fast can you scale?
Let’s break down the key numbers and trends that are shaping the future of this industry.
| Metric | Value |
|---|---|
| 2026 Market Size | USD 305.18 billion |
| 2031 Projected Market Size | USD 618.65 billion |
| CAGR (2026-2031) | 15.18% |
These numbers highlight an undeniable trend: the mobile app development market is not just growing, it’s accelerating. I’m seeing this firsthand working with both big companies and startups. So, what’s driving this?
To put it simply: Invest $1 million in app development today, and you could see a return of 200-400% within 18-24 months, depending on execution.
While the numbers vary slightly based on methodology, they all agree, this market is booming. And early movers are reaping the biggest rewards.
The mobile app development landscape is evolving fast, and the trends shaping 2026 will set apart the businesses leading the charge.
Here’s a quick rundown of the key trends you should be watching:
AI is now the backbone of mobile apps, not just a “nice-to-have.” From personalized experiences to predictive analytics, AI is making apps smarter and more efficient.
These platforms are growing at 26.7% CAGR, democratizing app creation. They reduce development costs by 40-60% and speed up time-to-market. One healthcare provider built a patient management app in just 6 weeks, a project that would have taken months using traditional development.
5G is more than just faster speeds, it’s enabling real-time AR/VR, seamless IoT connectivity, and edge computing. By 2026, 5G is expected to cover over 60% of global mobile connections, opening up new possibilities for mobile app features.
PWAs are bridging the gap between web and mobile apps. They’re cost-effective, offline-enabled, and don’t require app store submissions. I’ve seen businesses cut development costs by 60% using PWAs, while gaining the benefits of both web and native apps.
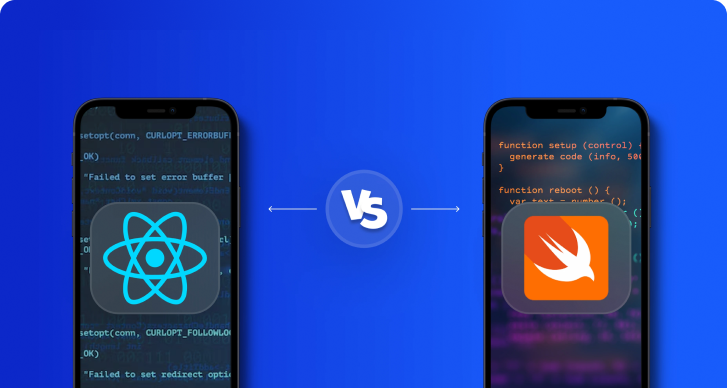
Tools like Flutter and React Native are now mature enough to be my go-to for 70% of projects. With a single codebase for both iOS and Android, businesses save 50-60% in development time while achieving performance close to native apps.
The AR/VR market is booming and set to hit $451.5 billion by 2030. I’ve implemented AR solutions for retail (boosting conversion rates by 35%) and real estate (reducing unnecessary site visits by 60%).
IoT is transforming mobile apps into control centers for smart homes, healthcare, and manufacturing. I’ve helped companies create apps that enable everything from remote patient monitoring to predictive maintenance in factories.
As regulations like GDPR and CCPA tighten, security is crucial. We’re seeing more biometric authentication, end-to-end encryption, and privacy-by-design features. In fact, Apple’s App Tracking Transparency has already rejected 12% of apps for non-compliance.
Cloud implementations now control 57.35% of the market and continue to grow at a 21.8% CAGR. Cloud-native apps offer scalability, low-latency access, and automated deployment, making them essential for modern app development.
These trends aren’t isolated, they’re interconnected. Companies combining AI, 5G, and IoT are seeing 3-5x better results than those implementing a single technology. If you’re not already incorporating these into your strategy, you’re falling behind.
As mobile app development continues its explosive growth in 2026, several key industry segments are leading the charge. By focusing on these high-potential sectors, businesses can strategically position themselves for success and maximize their return on investment.
Let’s take a quicker look at the segments fueling this growth and the opportunities they present before we dive into the details:
| Industry Segment | Market Share 2026 | Growth Rate (CAGR) | Typical Development Cost | Key Opportunity |
|---|---|---|---|---|
| Healthcare | Growing Fast | 20.08% | $100K-$300K | Telemedicine, Remote Monitoring |
| Retail/E-commerce | 33.70% | 15-18% | $60K-$200K | Mobile Commerce, AR Experiences |
| FinTech/Banking | Significant | 19.2% | $120K-$200K+ | Digital Banking, Payments |
| Gaming | 39.6% Revenue | 12-15% | $150K-$500K+ | In-App Purchases, Subscriptions |
| Education | Growing Rapidly | 21.5% | $50K-$150K | Adaptive Learning, E-Learning |
| Transport/Logistics | Established | 15-17% | $80K-$200K | On-Demand Services, Delivery |
Healthcare apps are exploding in demand, and the ROI here is impressive. Key drivers include the surge in telemedicine (remote consultations up 600% since 2020) and wearable device integration (over 80% of users now using health apps). AppVerticals has helped healthcare providers like Visionze enhance their patient management security and operations.
Fintech is rapidly growing, with a 19.2% CAGR. Digital banking is now a priority for traditional banks, and mobile wallets, blockchain, and investment platforms are revolutionizing the space.
Gifted Financial Services needed a unified digital platform to replace manual loan workflows, paperwork, and fragmented client records. AppVerticals suggested a cloud-native solution combining digital onboarding, secure document handling, automated underwriting, and integrated payments and delivered the same, ensuring they leverage the technology as much as possible.
Education apps are expected to reach $7.27 billion in 2026, with the market projected to grow 21.5% CAGR. The rise of adaptive learning and gamification is transforming how education is delivered, with engagement increasing by up to 80%.
Budget University needed a mobile LMS that could deliver interactive lessons, cross-subject integration, and real-life financial scenarios. AppVerticals engineered a system tested through 80+ prototypes, 2,500 user-study interactions, and six iterative UX cycles. Our efforts helped them achieve:
Transport and logistics apps are reshaping urban mobility. With real-time tracking, dynamic pricing, and multi-modal integration, ride-sharing and delivery services are booming. Building app like Uber Freight typically cost $80K-$200K to develop but offer significant growth potential in last-mile delivery and e-commerce fulfillment.
Geographic dynamics play a huge role in app strategy, costs, and market opportunities. Here’s a snapshot of the top markets in mobile app development for 2025 before we dig in the details:
| Region | Market Size 2026 | Growth Rate | Development Cost Index | Key Advantage | Primary Challenge |
|---|---|---|---|---|---|
| Asia-Pacific | $157.94B | 17.9% | Low (60-70) | Massive scale, growth | Fragmentation, localization |
| North America | $78.77B | 14.5% | High (100) | Premium users, ARPU | High development costs |
| Europe | $42.36B | 13.4% | High (90-95) | Quality, regulation | GDPR complexity |
| Middle East & Africa | $13.45B | Highest | Medium (70-80) | Government support | Infrastructure gaps |
| Latin America | $19.81B | 15-17% | Medium (65-75) | Young demographics | Economic volatility |
Asia-Pacific is experiencing the most explosive growth, with 52.92% of global market share in 2025. Key drivers include:
North America continues to lead with the highest revenue per user (ARPU). Here’s why:
Europe brings a high-quality, privacy-conscious user base but presents unique challenges:
MEA is an exciting emerging market with the highest growth rates projected:
Latin America presents an attractive, rapidly expanding market driven by mobile-savvy consumers:
Align your geographic strategy with your business model:
Understanding the true costs and timelines behind app development is crucial for making informed decisions. Here’s a breakdown that reflects realistic expectations, helping you plan your budget and avoid any unexpected expenses.
The complexity of your app plays a significant role in determining the development cost and timeline. Here’s a quick overview based on common app types:
| App Type | Cost Range | Timeline | Typical Features |
|---|---|---|---|
| Basic App (MVP) | $40K – $100K | 3-6 months | User auth, basic UI, simple database, API |
| Medium Complexity App | $100K – $200K | 6-9 months | Payment integration, social media, moderate backend |
| Complex Enterprise App | $200K – $400K+ | 9-18 months | AR/AI, real-time sync, high security, multiple platforms |
The range of mobile app development cost for each app type reflects its functionality and the level of complexity involved. A Minimum Viable Product (MVP) is a great starting point for testing your idea, while a more complex enterprise app involves additional features like AI, security, and integration with multiple platforms.
Costs can also vary significantly by industry. Different industries require different functionalities and levels of security, which impact development time and budget.
Below are the typical costs you should expect in 2026 across various sectors:
| Industry | Cost Range | Average Timeline | Key Cost Drivers |
|---|---|---|---|
| Healthcare | $150K – $300K | 9-12 months | HIPAA compliance, data security |
| FinTech | $120K – $250K | 9-15 months | Security, payment processing |
| E-commerce | $80K – $200K | 6-9 months | Payment integration, logistics |
| Gaming | $150K – $500K+ | 12-18 months | Graphics, monetization |
| Education | $60K – $150K | 6-9 months | Content management, video integration |
| Transportation | $100K – $250K | 9-12 months | Real-time tracking, mapping |
Certain industries, such as healthcare and fintech, require a higher budget due to complex regulatory compliance and security requirements. On the other hand, sectors like e-commerce or education typically have lower development costs due to less stringent regulations and simpler feature sets.
App development costs vary widely depending on where the work is done. The region you choose will impact the overall cost and quality of the product:
| Region | Developer Rates | Cost % vs North America | Best for |
|---|---|---|---|
| North America (U.S./Canada) | $100-$200/hour | 100% | Complex projects, IP-sensitive work |
| Western Europe | $75-$150/hour | 70-90% | High-quality development, GDPR compliance |
| Eastern Europe | $40-$80/hour | 40-60% | Cost-effective, high-quality work |
| Asia (India/Philippines) | $20-$50/hour | 30-50% | Maximum cost-efficiency |
North America offers the highest quality and fastest communication, but it comes at a premium cost. If you need to optimize your budget, Eastern Europe and Asia provide excellent alternatives, though communication can be more challenging.
A successful mobile app goes through multiple phases, each with its own cost implications. Here’s quick mobile app development guide offering the typical timeline and costs involved in each stage:
| Phase | Cost % | Timeline | Activities |
|---|---|---|---|
| Phase 1: Discovery & Planning | 5-10% | 2-4 weeks | Requirements, market research, technical assessment |
| Phase 2: UI/UX Design | 10-15% | 3-6 weeks | User flows, wireframes, visual design |
| Phase 3: Development | 50-60% | 8-16 weeks | Front-end, back-end, API, database |
| Phase 4: Testing & QA | 15-20% | 2-4 weeks | Functional, performance, security testing |
| Phase 5: Deployment | 5-8% | 1-2 weeks | App store submission, launch monitoring |
| Phase 6: Post-Launch Support | 15-20% | Ongoing | Bug fixes, updates, performance monitoring |
Each phase is integral to the final outcome of your app. Skipping or rushing through phases like Discovery & Planning or Testing can lead to issues later on that could significantly impact both cost and timeline.
By adopting a hybrid approach, leveraging both high-quality regions for strategy and more cost-effective ones for implementation, you can achieve the best of both worlds, saving up to 30-40% on your project.
The good news? When done right, mobile apps generate 3-5x ROI within 24-36 months through increased revenue, reduced costs, and improved customer engagement. The key is investing wisely in the right features, quality development, and proper architecture from day one.
Mobile app development is evolving rapidly, with trends already shaping the future. Here’s where the industry is heading by 2030, based on current data and emerging innovations.
Global AI market is expected to reach $1.8 trillion by 2030, with mobile apps being key contributors.
AI is becoming the backbone of mobile apps, enabling hyper-personalized user experiences and next-level automation. By 2030, AI will be a core feature in nearly every app.
Hyper-Personalization at Scale
Generative AI Integration
On-Device AI Processing
AR/VR market will reach $451.5 billion by 2030. Augmented Reality (AR) and Virtual Reality (VR) are becoming mainstream tools in retail, healthcare, education, and more, evolving from niche technologies to essential business solutions.
Augmented Reality (AR) Applications
Virtual Reality (VR) Applications
Mobile apps will control 75 billion connected devices by 2030.
Smart Home Control
Health and Wellness IoT
Industrial IoT Applications
60% of global connections will be 5G by 2025. Here’s why and how:
Real-Time Multiplayer Experiences
Edge Computing
Regulatory Landscape: GDPR, CCPA, PIPL, and other global privacy regulations.
Zero-Knowledge Architecture: End-to-end encryption and decentralized storage to protect user data.
Privacy-Enhancing Technologies: Differential privacy, federated learning, and homomorphic encryption to enhance data security without compromising functionality.
Super apps are exploding in popularity, especially in Asia-Pacific.
For Example,
Subscription apps are growing at 17.4% CAGR.
No-code platforms are projected to grow from $28.11 billion in 2024 to $35.61 billion in 2026.
For Businesses
For Developers
Environmental impact will become a key factor in app development.
| Trend | Market Size 2030 | Current Adoption | Investment Priority | ROI Timeline |
|---|---|---|---|---|
| AI Integration | $1.8T | 35% of apps | High (Critical) | 6-12 months |
| AR/VR | $451.5B | 15% of apps | Medium (Growing) | 18-24 months |
| IoT Connectivity | 75B devices | 40% integration | High (Expanding) | 12-24 months |
| 5G Optimization | 60%+ coverage | 20% optimized | Medium (Prepare) | 24-36 months |
| Privacy-First | Mandatory | 60% compliant | High (Required) | 6-12 months |
| Subscription Models | Dominant | 45% of revenue | High (Proven) | 3-6 months |
The apps that will dominate by 2030 will seamlessly integrate AI, respect user privacy, provide immersive experiences, and offer continuous value to users.
After walking you through market size, trends, opportunities, and practical considerations, let me be direct: The mobile app development market isn’t just growing, it’s becoming the primary interface between businesses and customers across every industry.
With the market projected to grow from $305.18 billion in 2026 to $618.65 billion by 2031 at a 15.18% CAGR, the question isn’t whether to invest in mobile, it’s how quickly you can execute a strategy that positions your business for this mobile-first future.
AppVerticals has helped hundreds of executives navigate mobile app investments. The ones who succeed aren’t necessarily the ones with the biggest budgets or most innovative ideas. They’re the ones who execute methodically, stay focused on business outcomes, and adapt based on real-world results.
The mobile app development market is $305 billion and growing 15% annually because mobile apps generate real business value when done right. Your competitors are investing. Your customers expect mobile experiences. The technology is mature and accessible.
The only question left: When will you start?
AppVerticals recommend: Now. The best time to invest was five years ago. The second-best time is today. Every month you delay is a month of opportunity lost to competitors who are already building.
Start with that MVP. Define those 3-5 core features. Launch in 6 months. Iterate based on data. Scale what works.
Industry-specific costs:
Hidden costs to budget: Third-party services (5-10%), app store fees (15-30% of revenue), annual maintenance (15-20% of initial cost), and marketing/user acquisition.
Largest revenue segments:
Phase breakdown looks like:
Factors accelerating ROI:
Success metrics: Well-executed apps typically generate 3-5x ROI within 24-36 months through increased revenue, cost savings, and improved customer engagement.
Choose cross-platform (Flutter, React Native) when:
70% of our clients do cross-platform. Reserve native for gaming, AR-heavy apps, or when performance is non-negotiable.
verified expert
Zainab helps tech brands sound more human. She takes app ideas, features, and updates and turns them into content people actually want to read. Whether it’s for a launch, a campaign, or just making things clearer, she’s all about simple words put together to form stories that stick.
 We’re AppVerticals
AppVerticals is where innovative startups and Fortune 500s come for transformation.
View About Us Mobile App
Boston has quietly become a center for product-grade mobile engineering. Massachusetts biopharma companies alone attracted $7.89 billion in VC funding...
14 min read
 Mobile App
Building a successful mobile app is not only about having a great concept or idea, instead, choosing the right partner is equally important. When it c...
19 min read
 Mobile App
Instagram has redefined digital interaction by emphasizing visual content through photos, videos, stories, and reels. Its influence stretches beyond p...
7 min read
Discover how our team can help you transform your ideas into powerful Tech experiences.
AppVerticals © 2026 | All Rights Reserved
Get In Touch.


 ChatGPT
 Perplexity
 Google AI


