














 ChatGPT
 Perplexity
 Claude
 Google AI
Agentic AI statistics in 2026 describe a market growing far faster than the systems inside it are stabilizing. Analyst forecasts put the category on a steep climb through 2030, and Gartner projects that 40% of enterprise applications will carry task-specific AI agents by the end of 2026, up from under 5% in 2025.
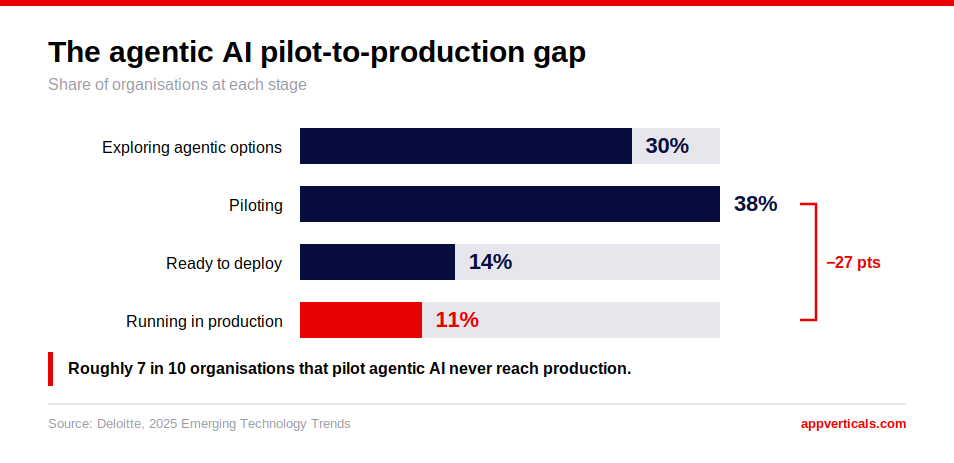
The deployment numbers tell a different story. Deloitte finds 38% of organisations piloting agentic systems and 11% running them in production. MIT’s Project NANDA found roughly 5% of integrated AI pilots extracting measurable value, with the rest showing no P&L impact. Gartner expects more than 40% of agentic AI projects to be cancelled by 2027.
I spend most of my week inside that gap. What follows is where adoption, ROI and market size genuinely stand in 2026, which of the competing failure statistics to use for which question, and the engineering reasons a working pilot stalls before production.
Agentic AI Statistics 2026: The Headline Numbers
| Statistic | Value | Source | Data Collected |
|---|---|---|---|
| Enterprise applications embedding task-specific AI agents by end-2026 | 40%, from under 5% in 2025 | Gartner | Issued 26 Aug 2025 |
| Organizations piloting agentic AI | 38% | Deloitte | 2025 |
| Organizations running agentic AI in production | 11% | Deloitte | 2025 |
| Agentic AI projects expected to be cancelled by end-2027 | Over 40% | Gartner | Issued 25 Jun 2025 |
| Integrated AI pilots extracting measurable value | ~5% | MIT NANDA | Jan–Jun 2025 |
| Pilot deployment rate: external partner vs internal build | ~67% vs ~33% | MIT NANDA | Jan–Jun 2025 |
| Companies with a mature governance model for autonomous agents | 21% | Deloitte | Aug–Sep 2025 |
| Agentic AI vendors Gartner assesses as genuinely agentic | ~130 of several thousand | Gartner | Issued 25 Jun 2025 |
How Big Is the Agentic AI Market? Size, CAGR and Forecasts
Those two figures describe the same shift from opposite ends. One counts revenue created, the other counts revenue displaced, and the second is the one software buyers should be reading.
Total-market estimates are shakier, and the reason is a moving category boundary. A vendor that relabels a workflow automation product as agentic gets counted, and the analyst firms draw that line in different places. Published 2024 baselines vary by roughly a factor of two, 2030–2034 projections vary by an order of magnitude, and compound growth rates cluster in the 40–46% range.
Gartner puts a sharper number on the boundary problem: of the several thousand vendors now marketing agentic products, roughly 130 are assessed as genuinely agentic. The rest is what Gartner calls agent washing, the rebranding of assistants, chatbots and robotic process automation without meaningful autonomy. When you quote a market size, name the firm and the year, because a board that discovers a headline projection came from one press release will discount everything else in the deck.
The forecast worth most attention is the structural one. Agentic capability moving from under 5% of enterprise applications to 40% inside eighteen months is a statement about software packaging. Most organizations will acquire their first production agent by upgrading something they already own, through Salesforce Agentforce, Microsoft Copilot Studio or an equivalent, rather than by commissioning a build.
Agentic AI Adoption Rates by Company Size, Stage and Industry
Read those four numbers as a funnel and the shape becomes obvious. Roughly seven in ten organizations that start a pilot do not have it in production. That attrition is the most important pattern in agentic AI right now.
Enterprise organizations lead on absolute adoption, which follows from having dedicated AI budgets and platform teams. Mid-market and SMB adoption is growing faster year over year, largely because turnkey agentic features arrived inside software those companies already license.
By sector, the strongest movement sits in financial services, insurance and customer-support-heavy operations. Insurance recorded the sharpest single-year jump of any industry as AI moved into claims processing and underwriting. Healthcare adoption is high in absolute terms but concentrated in predictive and documentation use cases rather than autonomous action, which is a meaningful distinction when you read a sector table.
For the wider view across all AI automation rather than agents specifically, our enterprise AI automation statistics round-up covers the adoption and ROI picture in more depth.
What ROI Are Companies Actually Reporting from Agentic AI?
The most quoted ROI figure in this category is an average return of roughly 171%, and it comes from surveys asking executives what return they expect. That is the central problem with agentic AI ROI data: most published returns are projected rather than measured. Treat the number as a signal about confidence and budget intent, because quoting it as realized value will cost you credibility with a CFO.
Measured returns look more modest and more uneven. McKinsey’s State of AI research has consistently shown that where organizations report cost savings from AI, most place those savings under 10% of the function’s cost base, and only a minority report any enterprise-level EBIT impact at all.
Where I see returns land reliably is narrow, high-volume, repeatable work with a clear success metric. Ticket triage, document extraction, claims intake, reconciliation. Broad transform-the-department mandates are where measurable value tends to evaporate.
What Is Blocking Agentic AI Adoption? Security, Governance and Skills
Governance maturity is the constraint I run into most, and Deloitte quantified it well. Only 21% of companies report having a mature governance model for autonomous agents, drawn from a survey of 3,235 business and IT leaders across 24 countries conducted in August and September 2025.
That number matters more for agents than it did for chatbots. A generative AI assistant produces output a human reviews before anything happens. An agent takes the action. When the process it is executing is undocumented, or the underlying data is contested between two systems, the agent commits the error at machine speed and under your organisation’s name.
Security concerns rank as the top-cited barrier in most adoption surveys. The threat surface is genuinely different, and memory poisoning, tool misuse and privilege escalation have no clean equivalent in traditional application security.
The barrier that shows up in my calls but rarely in surveys is integration readiness. An agent needs live, authenticated, rate-limit-aware connections to the systems where the work actually happens. In a pilot those connections are usually mocked or pointed at a data snapshot, which is exactly why the pilot succeeded.
I have written separately about connecting an agent to your real data and tools, covering the three integration patterns and where each one breaks.
Multi-Agent Architecture and Agent Platform Statistics
Gartner expects one-third of agentic AI implementations to combine agents with different skills by 2027, and a third of user experiences to shift from native applications to agentic front ends by 2028. Multi-agent coordination, where several specialized agents divide a workflow rather than one general agent handling all of it, is where the forecasts converge.
The second number is the one with teeth. A third of interactions moving away from application interfaces changes how software gets priced and bought, which is the same disruption the $234 billion figure describes from the revenue side.
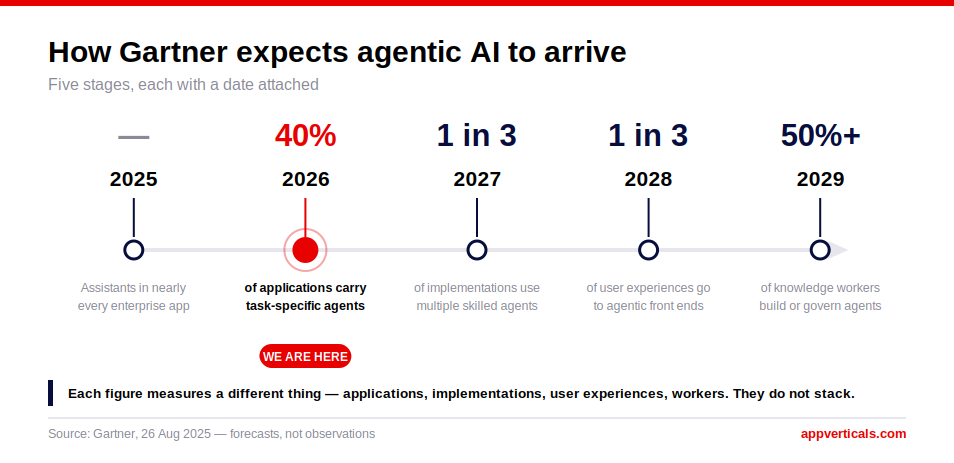
Reading that sequence against what I see in client work, the packaging point matters more than the dates.
No neutral, reproducible benchmark of autonomous task completion across commercial agent platforms exists today. The completion rates in circulation come from vendor-run or single-firm studies with undisclosed task sets, so treat any headline completion percentage as marketing until the methodology is published.
Peer-reviewed research on how these systems fail is a great deal more useful, and the next three sections work through it.
The Agentic AI Failure Rate Reconciliation
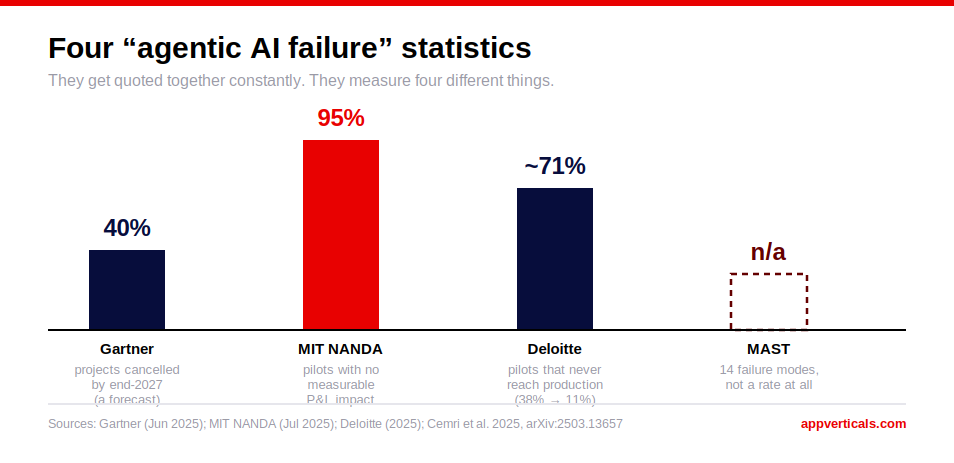
Four failure statistics dominate this conversation, and they get quoted in the same paragraph as though they corroborate each other. They measure four different things, across different populations, on different dates.
| Figure | Value | What It Actually Measures | Population | Date |
|---|---|---|---|---|
| Gartner | Over 40% cancelled by end-2027 | Projects abandoned before completion. A forecast. | Jan 2025 poll of 3,412 respondents | 25 Jun 2025 |
| MIT NANDA | ~95% no measurable P&L impact | Whether a pilot produced measurable financial return. | 300+ disclosed initiatives, 52 org interviews, 153 leader surveys | Jan–Jun 2025 |
| Deloitte | 38% piloting to 11% in production | Pilot-to-production conversion rate. | Emerging Technology Trends survey | 2025 |
| Cemri et al. (MAST) | 14 failure modes across 3 categories | Technical failure modes in multi-agent systems and their distribution. | 1,600+ traces, 7 frameworks, 200+ tasks | Mar 2025 |
Read down the third column and the apparent contradiction dissolves.
Gartner’s number is a prediction about budget decisions, informed by a January 2025 poll of 3,412 respondents on investment posture. MIT’s is a measurement of financial outcome across generative AI broadly, and the wording matters: roughly 5% of integrated pilots were extracting measurable value, and the other 95% showed no measurable P&L impact.
Deloitte is measuring the thing most people think they are asking about, which is how many pilots go live.
The MAST figures belong to a different layer entirely. They are engineering data about how multi-agent systems break, not a business statistic about how many projects get cancelled.
There is a serious counter-argument to the headline framing. Pilots are supposed to fail. A 5% hit rate on genuinely transformative tooling sits close to normal for enterprise IT, and the same figure that reads as catastrophe in a headline reads as healthy experimentation to anyone who has run a technology portfolio.
Which number should you use? For forecasting budget risk, use Gartner. For estimating whether your pilot will go live, use Deloitte. For diagnosing why a specific system is failing, use MAST. MIT’s 95% will mislead you on all three.
What It Costs to Build and Run an Agentic AI System
No published market report answers the question I get asked most often, which is what one of these actually costs. Market sizing tells you the category is large. It tells you nothing about your line item.
Cost in agentic systems is driven by integration surface far more than by model choice. Inference is rarely the dominant line, and it keeps getting cheaper. The spend concentrates in four places.
Integration. Every system the agent touches needs authenticated, rate-limited, failure-tolerant connectivity. A workflow crossing five systems where two have no usable API is a different project from one crossing two modern REST services. This is where the majority of the engineering hours go.
Evaluation infrastructure. You cannot ship an agent you cannot measure. Building the test harness, the golden datasets and the regression suite is real engineering, and it is the line teams most often forget to budget.
Observability and governance. Action logging, audit trails, permissioning, human-approval thresholds and escalation paths. This is the work legal and compliance will stop you over if it is missing, usually late.
Ongoing operation. Inference, monitoring, and the maintenance load that arrives when an upstream system changes its schema and the agent starts confidently doing the wrong thing.
The most common budgeting error I see is scoping the pilot and assuming production costs a multiple of it. Production is a different build. The pilot proved a model can do the task. Production has to answer roughly fifteen more questions at once, and the four items above are all of them.
If you want a usable estimate, price the integration surface first. Count the systems, check which ones have a real API, and decide what an agent is allowed to do without a human signing off. Those three answers move the number more than any model decision you will make.
The Engineering Failure Modes Behind the Cancellation Statistics
When a board reads that 40% of agentic projects will be cancelled, the natural conclusion is that the models are not good enough yet. The research says otherwise.
The most rigorous public work on this is MAST, the Multi-Agent System Failure Taxonomy, published by Cemri and colleagues at Berkeley in 2025 and presented at NeurIPS that year. The team analyzed over 1,600 annotated execution traces across seven popular multi-agent frameworks, with six expert human annotators reaching a Cohen’s kappa of 0.88, which is strong agreement for this kind of qualitative coding.
They identified 14 distinct failure modes, grouped into three categories, and measured how failures distribute:
- Specification issues, 41.77%. Ambiguous task definitions, unclear role boundaries, missing constraints, agents that never recognise when a task is complete.
- Inter-agent misalignment, 36.94%. Communication breakdowns, state desynchronisation, agents working from conflicting interpretations of the same goal.
- Task verification, 21.30%. Inadequate output checking, missing validation, errors propagating unchallenged down the chain.
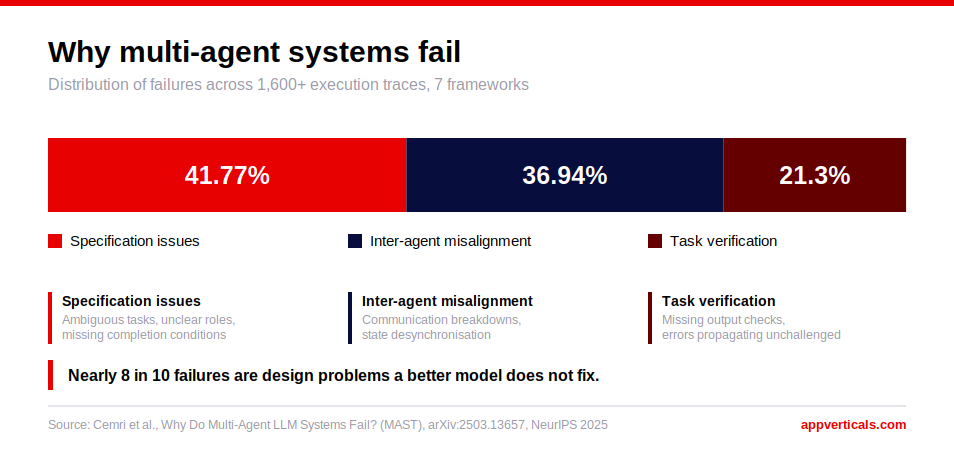
Nearly eight in ten failures trace back to how the system was specified and how the agents coordinate. Those are design and engineering problems. A better model does not fix an ambiguous role definition or an absent verification step.
This also explains why the pilot-to-production drop is so steep. A pilot runs a happy path with a clean scope, so specification ambiguity never surfaces. Production runs edge cases all day.
If you want one operational metric to govern an agent programme, use override rate, the proportion of agent actions a human reverses. Usage tells you people opened it. Override rate tells you whether they trust it. A system being overridden most of the time is not in production in any meaningful sense, whatever the deployment dashboard says.
For the deeper engineering view, our guide to multi-agent systems that survive production works through the architectural decisions behind these failure modes.
The Statistic Almost Nobody Quotes
Buried in MIT’s NANDA report is the finding that should be leading every one of these round-ups.
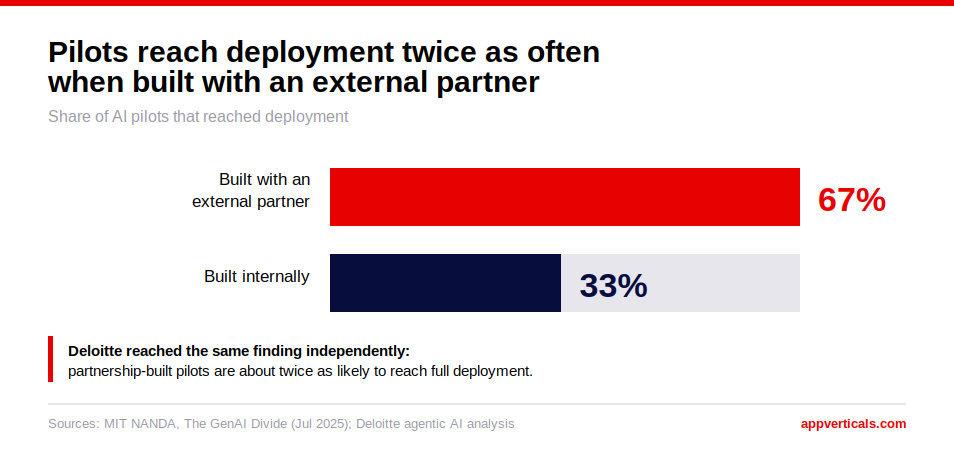
Pilots run through external partnerships reached deployment around 67% of the time. Internally built tools reached deployment around 33% of the time. The report notes these are self-reported outcomes, while adding that the size of the gap held consistently across interviewees.
Deloitte reached the same conclusion independently. Their agentic AI analysis found pilots built through strategic partnerships are roughly twice as likely to reach full deployment as internal builds, with employee usage rates nearly double for externally built tools.
Two separate research programmes, different methodologies, same direction, roughly the same magnitude. That is about as strong as evidence gets in this field.
I build these systems for a living, so read that finding with the scepticism it deserves. The mechanism behind it is more useful than the headline anyway.
What This Means for Your Next Decision
Market size, budget allocation and pilot counts are all climbing steeply. Production deployment, measured returns and governance maturity are not. Every figure in this report sits on one side of that split, and working out which side is most of the job.
The distance between those curves is an engineering and governance gap. Nearly 80% of documented multi-agent failures come from specification and coordination problems, and no model upgrade resolves those.
If you are deciding where the next agentic budget goes, two figures carry the most weight. Deloitte’s 11% production rate tells you the realistic odds. MIT’s 67-versus-33 partnership gap tells you the strongest lever you have on them.
Before committing that budget, work out whether the process you want to automate is documented well enough for an agent to execute it at all. That answer determines more than the technology choice does.
Is your business actually ready for agentic AI?
Our readiness guide covers what agentic AI does, where it fits, and the questions to answer before you scope a build.
Read NowWorking through an integration pattern instead? Start with how to add agents to your existing apps.