
About Us
About Us
We’re a future-focused tech partner working with some of the world’s top enterprises. At AppVerticals, we design solutions that drive growth and reimagine digital experiences.

Services
Software Development
Mobile App Development
Web Design & Development
Tell us what you're looking for, and we'll tailor a solution based on your business needs.
Talk to Experts
Health Tech

EdTech

Logistics

Real Estate

Ecommerce

Sports

Fintech

Travel

Restaurant

Automotive
HIPAA-compliant digital solutions for hospitals, clinics, and healthtech startups driving better patient outcomes.
What we do:
Scalable learning platforms for schools, universities, and EdTech startups transforming education delivery.
What we do:
Real-time tracking and automation solutions for freight companies, warehouses, and delivery services.
What we do:
PropTech platforms for brokerages, property managers, and real estate marketplaces are streamlining operations.
What we do:
High-converting commerce platforms for D2C brands, retailers, and online marketplaces are driving revenue growth.
What we do:
Fan engagement platforms for sports teams, leagues, and betting operators are creating immersive experiences.
What we do:
PCI-DSS compliant solutions for digital banks, payment platforms, and InsurTech companies, ensuring security.
What we do:
Booking and hospitality solutions for OTAs, hotels, and tourism platforms, enhancing traveler experiences.
What we do:
Online ordering and operations software for restaurants, cloud kitchens, and food delivery platforms.
What we do:
Connected vehicle platforms for automotive OEMs, dealerships, and mobility providers are accelerating innovation.
What we do:
Our Odoo implementation brings financial discipline, operational visibility, and process control across departments. From accounting automation to manufacturing workflows, we design ERP systems that reduce operational leakage and provide real-time decision clarity.
We use Sitecore to drive measurable revenue growth through intelligent personalization and behavior-driven content delivery. By aligning marketing automation, data orchestration, and omnichannel engagement, we help brands turn digital touchpoints into retention engines.
We architect AWS environments that stay stable under scale, traffic spikes, and compliance pressure. From secure cloud migrations to CI/CD automation and cost governance, we engineer cloud foundations that protect performance while enabling rapid product evolution.
We implement Dynamics 365 to align systems with actual business operations, bringing clarity, control, and accountability across CRM, ERP, and service functions. From sales to finance, configurations eliminate inefficiencies and enable confident, real-time decisions.
Tell us what you're looking for, and we'll tailor a solution based on your business needs.
Talk to ExpertsPortfolio
AppVerticals was featured in Inc. 5000 as
America’s Fastest Growing Tech Company
See what it might cost to bring your app idea to life. Our calculator gives you a quick, simple estimate based on what you need.

 verified expert
AI & Data-Driven Content Strategist
Writes stat-driven, expert-backed blogs that simplify complex AI products and forecast what’s next.
See Full Bio12 minutes read
SaaS adoption is accelerating faster than ever. The global SaaS market reached $315.68 billion in 2025 and is projected to grow rapidly as businesses shift toward cloud-first operations. From enterprise adoption rates to SaaS spending and security challenges, these key SaaS development and adoption statistics reveal how the industry is evolving and what organizations should prepare for next.
In this comprehensive analysis, I will break down the most critical SaaS statistics you need to know to make informed investment decisions, optimize your tech stack, and secure your digital infrastructure.
According to recent authoritative reports, the global SaaS market was valued at $315.68 billion in 2025. Looking ahead, the forecast is even more aggressive.
North America remains the dominant force in the global landscape, holding approximately 46.9% of the global market share.
The U.S. market alone is home to roughly 17,000 SaaS companies, far outstripping other regions. For executives, this signals that North American standards and compliance regulations will continue to dictate global trends.
| Country | Estimated Number of SaaS Companies |
|---|---|
| United States | ~17,000+ |
| United Kingdom | ~4,500 |
| Germany | ~2,900 |
| India | ~2,400 |
| Canada | ~2,100 |
Based on the latest 2026 SaaS stats reflecting company counts, revenue, and market presence.
18.7% CAGR
Projected Compound Annual Growth Rate for the Global SaaS Market (2026-2034)
| Year | Projected Market Size (USD Billion) |
|---|---|
| 2025 | $315.68B – $408.21B |
| 2026 | $465.03B |
| 2029 | $793.10B |
| 2034 | $1,482.44B |
Businesses aiming to tap into this growth can rely on AppVerticals’ SaaS development expertise to build scalable and high-performing SaaS products.
Leverage AppVerticals’ SaaS development expertise to build high-performing, AI-enabled platforms that simplify operations and drive growth.
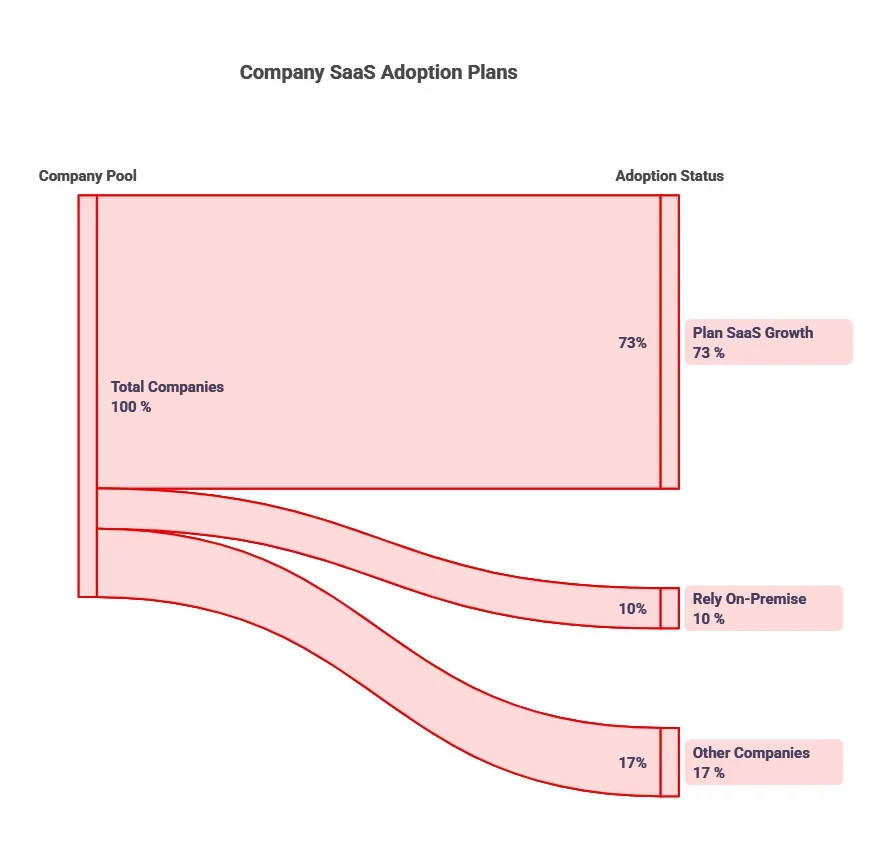
Around 73% of companies plan to grow their SaaS portfolios further, while only about 10% still rely primarily on on‑premise systems, highlighting the deep penetration of SaaS across industries.
The volume of applications managed by IT teams is staggering. The average organization now manages 275 SaaS applications.
This decentralized purchasing has led to a situation where 53% of SaaS licenses go unused, representing a massive, unseen drain on resources.
Average Number of SaaS Applications Managed by a Single Organization in 2025
The cost of equipping a modern workforce is rising. In 2025, the average SaaS spend per employee has reached $4,830, a significant 21.9% year-over-year increase. This surge is driven by vendor price hikes and the premium pricing of new AI-integrated features.
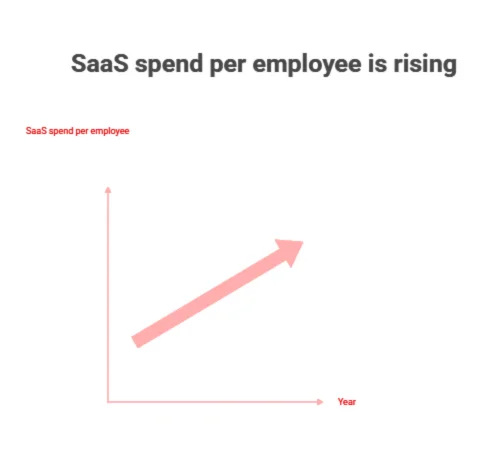
For instance, companies have seen returns as high as 338% from platforms like Slack, proving that the right tools pay for themselves multiple times over.
| Industry Sector | 2025 Average Spend | 2026 Projected Range* |
|---|---|---|
| Healthcare | $10,150 | $11,600 – $12,000 |
| IT / Software | $10,050 | $11,500 – $11,900 |
| Finance | $8,750 | $10,000 – $10,300 |
| Retail | $7,750 | $8,900 – $9,200 |
| Global Average | $4,830 | $5,500 – $5,700 |
At AppVerticals, we help organizations track SaaS spending, benchmark costs per employee, and optimize software subscriptions to maximize ROI and control expenses.
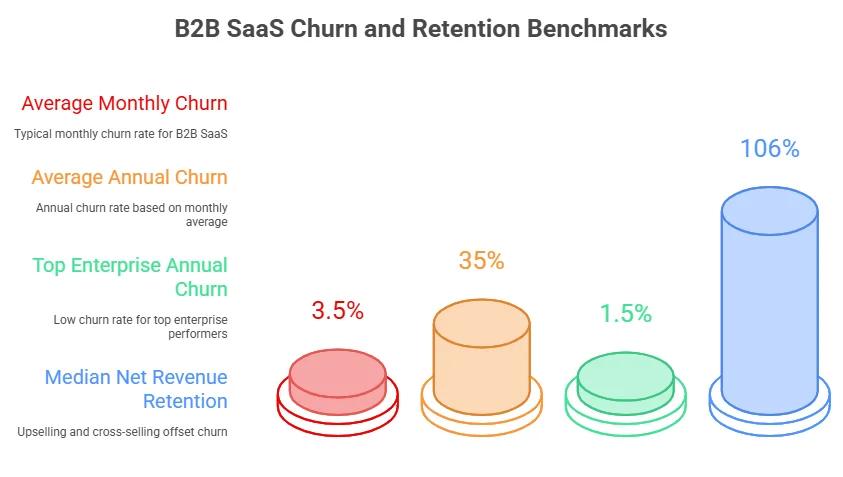
For SaaS developers and investors, churn is the silent killer. Retention metrics are the truest indicator of product-market fit and long-term viability in a subscription economy.
However, top performers in the enterprise space maintain annual churn rates as low as 1-2%. On the flip side, the median Net Revenue Retention (NRR) sits at a healthy 106%, indicating that upselling and cross-selling to existing customers is effectively offsetting churn.
About 92% of SaaS startups fail within the first three years, according to recent industry reporting and aggregated failure data. This reflects the brutal reality of high competition, cash‑burn pressures, and product‑market fit challenges in the SaaS space.
AI and emerging technologies are powering smarter SaaS platforms, driving automation, predictive insights, and personalized experiences that boost efficiency and business value.
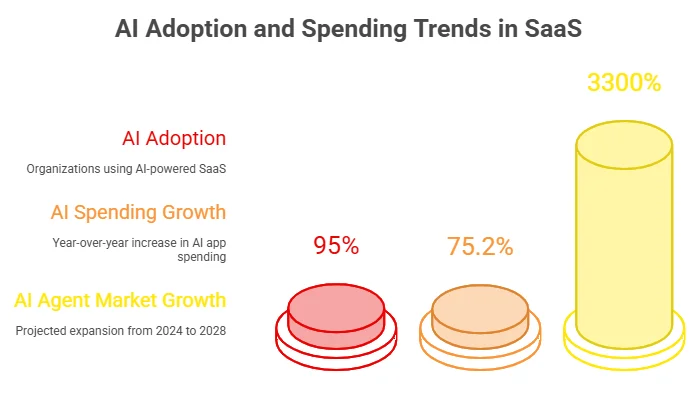
The efficiency gains are measurable and massive. Agentic AI is expected to automate 15% of work decisions by 2028. Already, sales professionals are saving over 2 hours daily through SaaS automation tools, fundamentally altering workforce productivity dynamics.
Year-over-Year Increase in Spending on AI-Native SaaS Applications
SaaS adoption varies by industry, with sectors like finance, healthcare, and retail leading in cloud adoption. Tailored solutions help businesses streamline operations, improve compliance, and enhance customer experiences within their specific industry.
On the smaller end of the spectrum, the Micro-SaaS model is thriving. These niche, low-overhead businesses are proving highly resilient.
Even more concerning, 77% of organizations have reported data loss related to insider actions, underscoring the urgent need for stronger governance and SaaS Management Platforms (SMPs).
Global SaaS revenue is projected to reach $908 billion by 2030. The infrastructure supporting this will be hybrid, with 90% of organizations expected to adopt hybrid cloud strategies by 2027. We will also see a massive wave of consolidation, as companies seek to reduce app sprawl and integrate disparate tools into unified platforms.
Expert Opinion:
The future of SaaS is increasingly moving toward integrated, AI-enabled platforms that simplify operations rather than adding more fragmented tools. Businesses are becoming overwhelmed by managing dozens of disconnected applications for accounting, CRM, inventory, project management, and customer support. As a result, there is a growing shift toward unified ecosystems where multiple business functions operate within a single platform.
Solutions like Odoo illustrate this trend by offering a modular yet integrated approach, allowing companies to scale their digital infrastructure without the complexity of stitching together numerous SaaS products.
In the coming years, successful SaaS platforms will likely be those that combine deep functionality, seamless integration, and intelligent automation to deliver not just software, but a cohesive operational system for businesses.
This growth was not just an anomaly; it set a new baseline for remote collaboration infrastructure, proving that SaaS platforms must be built to scale elastically overnight.
While Zoom remains the classic scalability example, NinjaOne’s explosive growth in 2025–2026 shows how modern SaaS platforms are flourishing outside the pandemic context.
The company now serves over 35,000 customers across 140+ countries, representing 60 % customer growth over the prior year — a clear signal that next‑gen SaaS tools are scaling rapidly in mid‑market and enterprise segments.
The SaaS statistics for 2026 paint a clear picture: the industry is maturing, expanding, and becoming more expensive to navigate.
The tools you select today, and how you manage them, will define your operational efficiency for the next decade.
verified expert
Writes stat-driven, expert-backed blogs that simplify complex AI products and forecast what’s next.
 We’re AppVerticals
AppVerticals is where innovative startups and Fortune 500s come for transformation.
View About Us Custom Software
A SaaS idea worth building in 2026 solves a specific, recurring business problem with measurable ROI. It comes from problems teams deal with daily, li...
32 min read
 Custom Software
Curious what are the top solutions for integrating flexible computing systems in manufacturing and automation sectors? The quick answer is –adopting t...
5 min read
 Custom Software
SaaS integration is the process of connecting multiple cloud-based applications to automate workflows and synchronize data across business systems. It...
22 min read
Discover how our team can help you transform your ideas into powerful Tech experiences.
AppVerticals © 2026 | All Rights Reserved
Get In Touch.


 ChatGPT
 Perplexity
 Google AI


