
About Us
About Us
We’re a future-focused tech partner working with some of the world’s top enterprises. At AppVerticals, we design solutions that drive growth and reimagine digital experiences.

Services
Software Development
Mobile App Development
Web Design & Development
Tell us what you're looking for, and we'll tailor a solution based on your business needs.
Talk to Experts
Health Tech

EdTech

Logistics

Real Estate

Ecommerce

Sports

Fintech

Travel

Restaurant

Automotive
HIPAA-compliant digital solutions for hospitals, clinics, and healthtech startups driving better patient outcomes.
What we do:
Scalable learning platforms for schools, universities, and EdTech startups transforming education delivery.
What we do:
Real-time tracking and automation solutions for freight companies, warehouses, and delivery services.
What we do:
PropTech platforms for brokerages, property managers, and real estate marketplaces are streamlining operations.
What we do:
High-converting commerce platforms for D2C brands, retailers, and online marketplaces are driving revenue growth.
What we do:
Fan engagement platforms for sports teams, leagues, and betting operators are creating immersive experiences.
What we do:
PCI-DSS compliant solutions for digital banks, payment platforms, and InsurTech companies, ensuring security.
What we do:
Booking and hospitality solutions for OTAs, hotels, and tourism platforms, enhancing traveler experiences.
What we do:
Online ordering and operations software for restaurants, cloud kitchens, and food delivery platforms.
What we do:
Connected vehicle platforms for automotive OEMs, dealerships, and mobility providers are accelerating innovation.
What we do:
Portfolio
AppVerticals was featured in Inc. 5000 as
America’s Fastest Growing Tech Company
See what it might cost to bring your app idea to life. Our calculator gives you a quick, simple estimate based on what you need.

 verified expert
Researcher | Writer
Madiha sits at the intersection of AI, apps, and human behavior. She turns product complexity into stories users and teams actually get.
See Full Bio7 minutes read
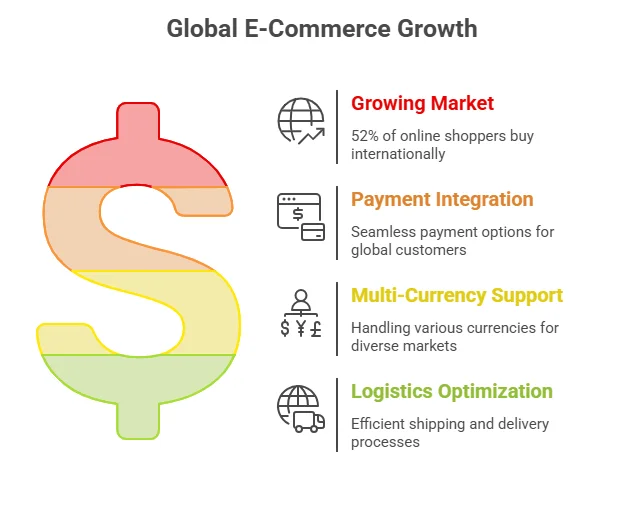
E-commerce app development has become the backbone of modern retail. Mobile commerce now drives over 70-78% of all e-commerce transactions worldwide, making apps the dominant revenue channel for digital businesses.
Businesses investing in mobile-first, AI-driven apps are capturing more market share, while web-only brands fall behind. Apps are no longer an extension; they drive revenue, engagement, and retention.
This blog compiles key statistics on market size, user behavior, AI adoption, costs, ROI, and emerging trends, giving a complete view of e-commerce app development in 2026.
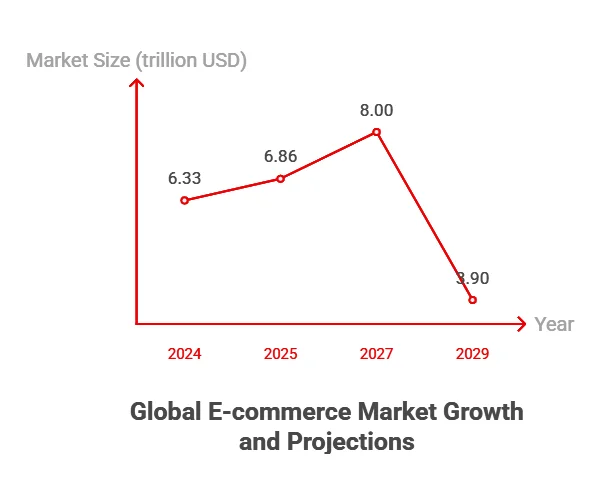
By 2029, online shoppers are expected to reach 3.9 billion, while the e-commerce app market alone is projected to be $3.9 trillion.
This demonstrates that apps are not merely supplementary; they are driving industry growth. Businesses without apps risk losing market share to mobile-first competitors.
The United States, the United Kingdom, Germany, India, and Canada lead globally, driven by high mobile adoption and strong digital spending. These markets offer the biggest opportunities for scalable, app-first e-commerce growth.
| Country | Number of E-commerce App Companies | Mobile/Revenue Stats |
|---|---|---|
| United States | ~17,000 | Mobile commerce sales in the U.S. reached approximately $564 billion in 2024 (44% of total eCommerce revenue), projected to reach ~$745 billion by 2026 |
| United Kingdom | 4,500+ | mCommerce accounts for 60% of transactions |
| Germany | 2,900 | €122B in online sales |
| India | 2,400+ | Smartphone-driven e-commerce: $120B (2025) |
| Canada | 2,100 | 55% of online sales |
Insight: Regional stats highlight where the biggest opportunities lie for app development, especially in mobile-first countries.
This confirms that mobile-first strategies are essential for maximizing engagement and revenue.
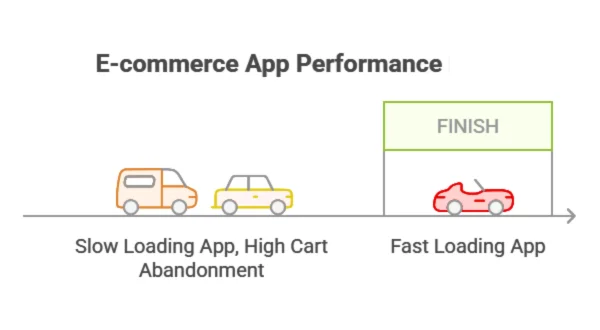
However, 53% abandon an app if it takes longer than 3 seconds to load, and global cart abandonment is 69.99%. Push notifications increase conversions by 88%, emphasizing engagement strategies.
Insight: Fast performance, smooth UX, and timely engagement are critical for retention and revenue.
Businesses aiming to maximize ROI can benefit from AppVerticals’ mobile app development services, delivering AI-powered, mobile-first, high-performing e-commerce apps.
High retention requires fast load times, seamless checkout, and engaging features, which directly affect revenue and ROI.
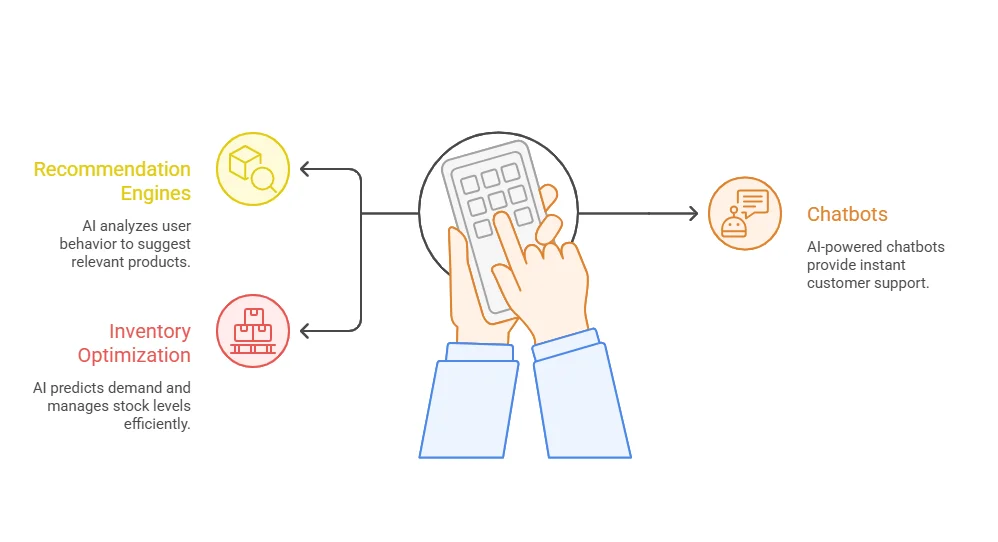
AI powers recommendation engines, chatbots, and inventory optimization, and is projected to grow into a $45.72B market by 2032, solidifying its role in modern app development.
Apps that integrate social commerce features, like influencer-driven content and live shopping, see higher engagement and conversion rates.
Insight: Higher investment often yields better ROI, scalability, and retention.
Cross-platform frameworks like React Native (52%) and Flutter (38% YoY growth), along with e-commerce platforms such as Magento, Shopify, and WooCommerce (61%), are widely used to build scalable, high-performance applications. Cloud platforms like AWS and Google Cloud power 81% of serverless apps, reducing costs and improving performance.
Turn insights into action! Leverage 2026 app development statistics to launch AI-powered, mobile-first e-commerce apps that boost revenue and retention.
Starbucks’ app increased customer retention by 30% and mobile orders by 22% through personalized recommendations, gamification, and push notifications. Their seamless mobile experience demonstrates how AI and app design directly impact revenue and engagement.
Sephora leveraged AI-driven product recommendations and virtual try-ons to boost in-app purchases by 25%, while loyalty program integration led to 40% higher repeat purchases. This case highlights the importance of personalization and immersive technology.
Amazon’s app accounts for over 60% of its total online sales, with features like 1-click checkout, personalized recommendations, and voice search. Amazon sets the benchmark for mobile-first e-commerce, proving the ROI of robust app experiences.
Businesses that invest in fast, AI-powered, mobile-first e-commerce apps are seeing 15–25% higher annual revenue, stronger retention, and significantly higher lifetime value.
Those that don’t are competing at a structural disadvantage in a market where speed, personalization, and experience define success.
Regional adoption, cross-border capabilities, and technology choices further differentiate success. Businesses investing in robust apps, like Starbucks, Sephora, and Amazon, demonstrate the measurable value of strategic app development.
verified expert
Madiha sits at the intersection of AI, apps, and human behavior. She turns product complexity into stories users and teams actually get.
 We’re AppVerticals
AppVerticals is where innovative startups and Fortune 500s come for transformation.
View About Us Mobile App
New Jersey may not get the same spotlight as Silicon Valley or New York City, but it has quietly become a hub for mobile app development. From startup...
9 min read
 Mobile App
In 2026, the average mobile app development cost ranges from $40,000 to $400,000 or more, depending on complexity, platform, and features. Mobile app...
22 min read
![AI_in_App_Development_Statistics[1]](https://www.appverticals.com/blog/wp-content/uploads/2025/12/AI_in_App_Development_Statistics1.png) AI
AI
The mobile app industry is undergoing a major transformation as AI in app development becomes the new norm. By 2026, 78% of organizations have integra...
24 min read
Discover how our team can help you transform your ideas into powerful Tech experiences.
AppVerticals © 2026 | All Rights Reserved
Get In Touch.


 ChatGPT
 Perplexity
 Google AI


