
About Us
About Us
We’re a future-focused tech partner working with some of the world’s top enterprises. At AppVerticals, we design solutions that drive growth and reimagine digital experiences.

Services
Software Development
Mobile App Development
Web Design & Development
Tell us what you're looking for, and we'll tailor a solution based on your business needs.
Talk to Experts
Health Tech

EdTech

Logistics

Real Estate

Ecommerce

Sports

Fintech

Travel

Restaurant

Automotive
HIPAA-compliant digital solutions for hospitals, clinics, and healthtech startups driving better patient outcomes.
What we do:
Scalable learning platforms for schools, universities, and EdTech startups transforming education delivery.
What we do:
Real-time tracking and automation solutions for freight companies, warehouses, and delivery services.
What we do:
PropTech platforms for brokerages, property managers, and real estate marketplaces are streamlining operations.
What we do:
High-converting commerce platforms for D2C brands, retailers, and online marketplaces are driving revenue growth.
What we do:
Fan engagement platforms for sports teams, leagues, and betting operators are creating immersive experiences.
What we do:
PCI-DSS compliant solutions for digital banks, payment platforms, and InsurTech companies, ensuring security.
What we do:
Booking and hospitality solutions for OTAs, hotels, and tourism platforms, enhancing traveler experiences.
What we do:
Online ordering and operations software for restaurants, cloud kitchens, and food delivery platforms.
What we do:
Connected vehicle platforms for automotive OEMs, dealerships, and mobility providers are accelerating innovation.
What we do:
Portfolio
AppVerticals was featured in Inc. 5000 as
America’s Fastest Growing Tech Company
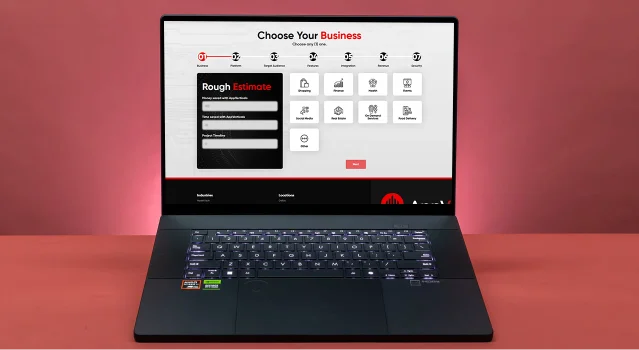
See what it might cost to bring your app idea to life. Our calculator gives you a quick, simple estimate based on what you need.
 verified expert
Researcher | Writer
Madiha sits at the intersection of AI, apps, and human behavior. She turns product complexity into stories users and teams actually get.
See Full Bio10 minutes read
When I advise CEOs, CFOs, and CTOs on app budgets, I start with one hard truth: app cost is no longer just about development. It’s about geography, talent, infrastructure, and ROI.
And the opportunity is huge. The U.S. alone has 322 million internet users and 411 million mobile connections, while the global iOS App Store ecosystem generated nearly $1.3 trillion in billings and sales in the last 2 years. The GCC is just as promising, with 99% internet penetration in the UAE and Qatar, and tens of millions of connected users across Saudi Arabia.
In 2026, the country you choose can impact your budget, speed, and ROI more than most teams realize.
A typical mobile app (mid-level complexity) can cost anywhere from ~$40,000 to $120,000+, depending on the country you choose.
| Country / Region | Estimated App Cost (Mid-Level App) | What Drives the Cost |
|---|---|---|
| United States | $100–$149/hour | High developer rates ($100–$149/hr), premium UX expectations |
| United Kingdom | $70,000 – $110,000 | Strong enterprise demand, high UX standards |
| UAE (GCC) | $60,000 – $100,000 | Regional expertise, bilingual UX, premium execution |
| Saudi Arabia (GCC) | $55,000 – $95,000 | Strong market demand, growing digital economy |
| Qatar (GCC) | $60,000 – $100,000 | Smaller market, high-value niche builds |
| Poland | $40,000 – $80,000 | Balanced cost-quality ratio ($50–$99/hr) |
| Spain | $30,000 – $70,000 | Lower rates ($25–$49/hr), solid EU talent |
| Ukraine | $30,000 – $70,000 | Cost-efficient, strong engineering talent |
I use a three-layer benchmark to price country differences: wage data, agency rates from Clutch, and complexity benchmarks from GoodFirms. This helps explain why the same product can be affordable in one market and expensive in another.
| Market | Public Talent Benchmark | Public Agency-Rate Signal | Demand / Commercialization Signal |
|---|---|---|---|
| United States | $66.40/hr mean wage / $133,080 median annual wage | $100–$149/hr | 322M internet users / 411M mobile connections |
| UAE | AED 154.89/hr / AED 322,175/yr | – | 11.1M internet users / 21.9M mobile connections |
| Saudi Arabia | SAR 113.15/hr / SAR 235,351/yr | – | SAR 88.3B Q3 e-commerce sales / 33.9M internet users |
| Qatar | QAR 7,680/mo | – | $6.25B ICT market / 99.0% internet penetration |
| United Kingdom | £30,000 starter / £75,000 experienced / £51,030 average | – | Mature market, strong enterprise fit |
| Canada | C$48.08/hr median | $100–$149/hr | North American governance and quality |
| Australia | A$109,689/yr / A$110,000–A$150,000 full-stack | $100–$149/hr | Mature English-speaking market |
| Spain / Poland / Ukraine | Spain $25–$49/hr / Poland $50–$99/hr / Ukraine $25–$49/hr | Spain $25–$49/hr / Poland $50–$99/hr / Ukraine $25–$49/hr | Europe’s cost-quality comparison set |
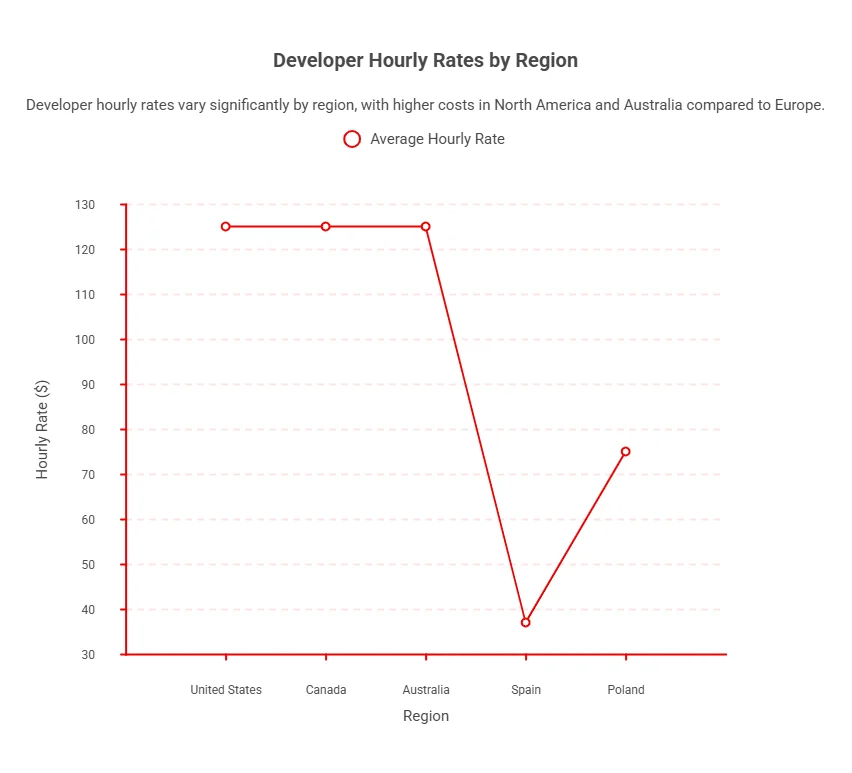
The average hourly rate for developers varies significantly by region, typically ranging from $25 to $149 per hour.
This wide variation means your choice of region can easily double or even triple your development costs, even before factoring in project scope, complexity, or team size.
App features and AI integration increase both upfront and ongoing costs, with AI introducing measurable recurring expenses.
UI/UX is a major driver of app timelines, especially with more screens, platforms, and testing cycles. In premium markets, higher user expectations demand polished design, making local builds feel justified once the UX workload is clear.
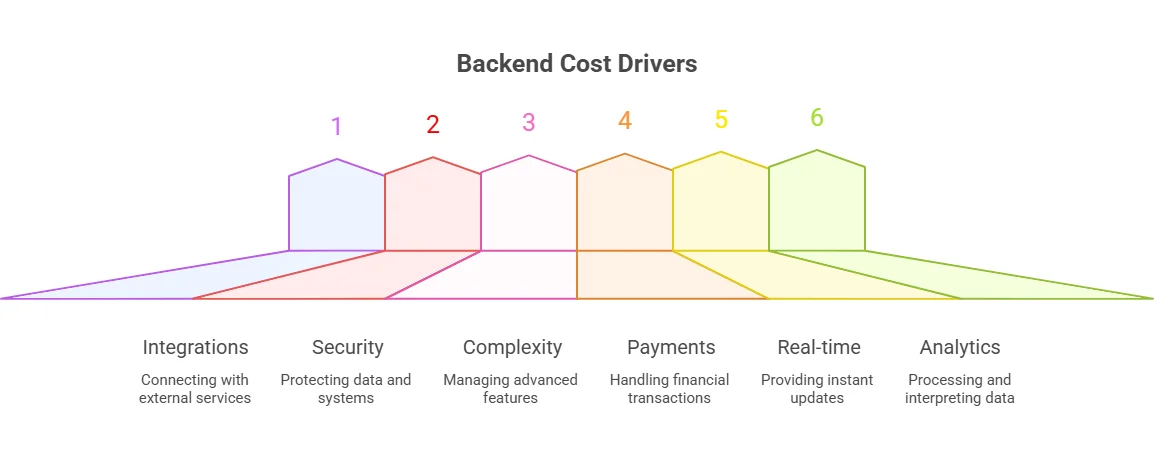
Backend costs rise with integrations, security, and complexity. Beyond MVP, into payments, real-time, or analytics, it becomes a major budget driver, not a side cost.
App budgets must include post-launch costs. Maintenance typically runs 15%–25% of the build cost annually.
Bottom line: if you only fund the launch, you haven’t funded the app.
App complexity directly drives development cost globally: the more features, integrations, platforms, and advanced tech, the higher the hours, backend effort, and post-launch maintenance, pushing budgets far beyond a basic MVP.
| Complexity | Hours Benchmark | GoodFirms Cost ($70/hr) | $100–$149/hr Market Impact |
|---|---|---|---|
| Simple app / MVP | 382–910 hours | $26,740–$63,700 | $38,200–$135,590 |
| Mid/complex app | 555.5–1,310 hours | $38,885–$91,700 | $55,550–$195,190 |
| Advanced / AI-heavy app | 915.5–2,110 hours | $211,785+ | $91,550–$314,390+ (before maintenance, cloud, and AI-ops overhead) |
Developer rates and market conditions vary widely, affecting cost vs. quality balance.
The U.S., Canada, and Australia typically charge $100–$149/hr for high-quality development, while Spain and Ukraine offer lower rates around $25–$49/hr, and Poland sits in the mid-range at $50–$99/hr.
The GCC region combines strong market relevance with high internet penetration, 99% in the UAE, Saudi Arabia, and Qatar, making it attractive for region-specific apps.
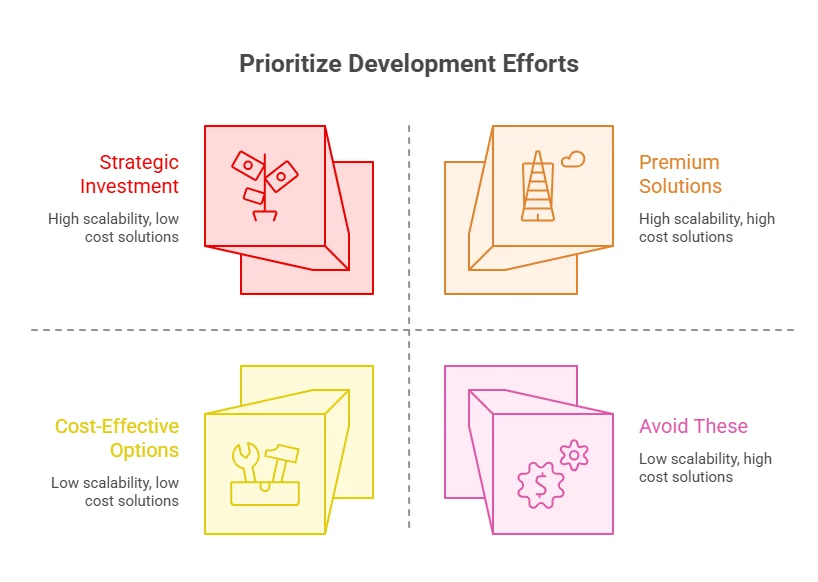
The choice depends on your priorities:
Best for compliance-heavy workflows and stakeholder-driven enterprise apps requiring strict governance.
Ideal for Gulf-focused apps needing bilingual support, local payment integration, and strong regional market alignment.
Balanced option for efficient product engineering, offering strong cost-quality tradeoffs with moderate local dependency.
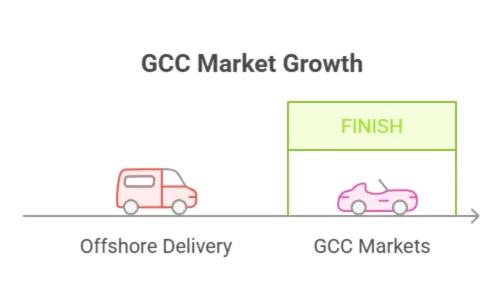
I prioritize GCC execution over cheaper offshore delivery when apps must sell, scale, or comply locally.
This is especially evident in regional builds like healthcare app development cost in Dubai, where localization, compliance, and Arabic UX play a major role in pricing.
Saudi Q3 2025 e-commerce sales hit SAR 88.3B, and the UAE targets 19.4% GDP from the digital economy, showing strong market and policy support.
I rarely recommend an extreme answer. Local-only is often too expensive. Offshore-only is often too risky. The best model in 2026 is usually a hybrid.
| Model | Best Use Case | Strongest Upside | Biggest Downside |
|---|---|---|---|
| Local team | Regulated products, close founder involvement, heavy discovery | Faster stakeholder feedback; stronger market context | Highest cash burn in premium markets |
| Offshore / nearshore | Build acceleration, cost pressure, and repeatable engineering work | Up to 40% cost savings and up to 50% faster time-to-market | Governance and product-context gaps |
| Hybrid | Most scale-up and enterprise roadmaps | Local product control + offshore execution leverage | Requires better program management |
Preferred structure: keep product ownership, architecture decisions, and compliance leadership close to the business, and leverage AppVerticals’ global delivery expertise to place implementation capacity wherever the economics are strongest.
From idea to launch, we design, develop, and scale high-performance mobile apps tailored to your market and users.
The formula I use is:
To control costs, I recommend four steps: scope an MVP, separate must-haves from “boardroom wishlist” features, reserve 15–25% of development costs for annual maintenance, and insist on outcome accountability if outsourcing; cheaper hours alone are a false economy.
If you’re evaluating execution partners, working with a reputed app development company can help you balance cost, scalability, and time-to-market with a structured, end-to-end development approach.
High-performing apps justify six- and seven-figure development budgets by driving retention, transactions, and platform consolidation at scale.
With 33.8 million U.S. Rewards 90-day active users (Q4 2024, +4% YoY), Starbucks shows how apps move beyond utility into revenue infrastructure. At this scale, investment in features, UX, and backend systems directly supports repeat purchases, loyalty economics, and customer data ownership, making ongoing development spend commercially rational.
The UAE Ministry of Economy describes Careem’s acquisition as a $3.1 billion deal and calls it the largest technology sector transaction in the Middle East. That is the cleanest GCC reminder I can give a board: regional apps are not side projects; under the right market conditions, they become strategic assets.
DubaiNow connects 250–320+ services across 35–50+ entities, showing how apps can replace fragmented systems with a single platform. This reduces long-term operational costs while increasing user adoption—justifying higher upfront investment through efficiency at scale.
The U.S. gives you a premium market with 322 million internet users and 411 million mobile connections. The GCC gives you extraordinary digital readiness, from the UAE’s 99.0% internet penetration to Saudi Arabia’s SAR 88.3 billion in Q3 2025 e-commerce sales and Qatar’s $6.25 billion ICT market.
And globally, the app economy’s upside is no longer theoretical when the App Store ecosystem alone facilitated nearly $1.295 trillion in 2024. My advice is straightforward: choose your build country the way you choose a capital-allocation strategy, because that is exactly what it is.
verified expert
Madiha sits at the intersection of AI, apps, and human behavior. She turns product complexity into stories users and teams actually get.
 We’re AppVerticals
AppVerticals is where innovative startups and Fortune 500s come for transformation.
View About Us Mobile App
The mobile app development market has experienced exponential growth over the past decade, and 2026 marks a pivotal year for businesses looking to lev...
22 min read
 Mobile App
Got an exciting app idea but not sure how to bring that to life and make it a hit in the super-crowded startup landscape of LA. You’re not alone and p...
15 min read
 Mobile App
If you’re asking do apps make money, you’re thinking like an operator, not just a builder. The real question is: which monetization model fits your ap...
21 min read
Discover how our team can help you transform your ideas into powerful Tech experiences.
AppVerticals © 2026 | All Rights Reserved
Get In Touch.


 ChatGPT
 Perplexity
 Google AI


