


 ChatGPT
-
Healthcare App Development Cost: Explores factors influencing healthcare app pricing.
-
Telemedicine App Development Cost: Breaks down telemedicine app pricing and key features.
-
Software Development Cost Estimation: Guides on estimating software development costs.
- Cost of Building an App by Country (2026): Compares global app development costs across regions to help you choose the right market.
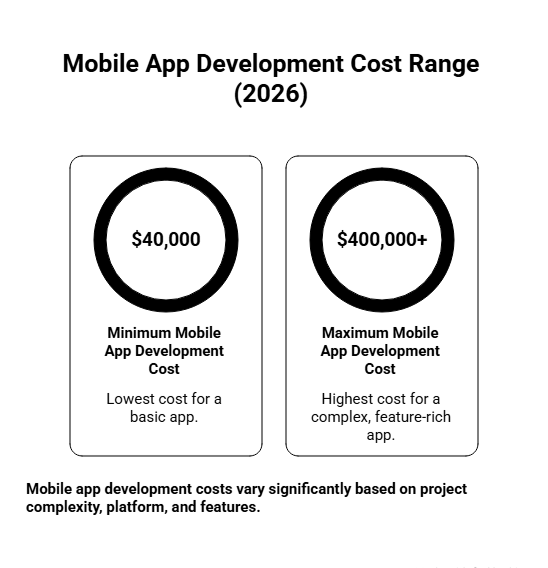
In 2026, the average mobile app development cost ranges from $40,000 to $400,000 or more, depending on complexity, platform, and features.
Mobile app development is no longer just a line item, it’s a strategic investment shaping your bottom line and scalability. The cost structure now includes not only development but also compliance, infrastructure, app store fees, user acquisition, and long-term retention, which can far surpass initial development costs as your app scales.
As expectations for UX, security, AI, and performance rise, so do engineering hours and risks. Gartner predicts a 25% drop in mobile app usage by 2027 due to AI assistants, making it crucial to focus your ROI strategy on retention, differentiation, and efficient unit economics.
In this guide, discover the true cost of mobile app development, including hidden expenses, cost drivers, and strategies to optimize your budget and ROI.
Key Takeaways:
- Average App Development Cost: Mobile apps development cost in 2026 range from $40K to $400K+ depending on complexity, features, and platform. Simple apps: $5K–$50K, Medium: $50K–$120K, Complex/AI-powered: $120K–$500K+.
- Factors Affecting Cost: App complexity, features, platform choice, UI/UX design, industry type, tech stack, backend infrastructure, and developer location are all the key factors driving the cost.
- Hidden Costs: Post-launch expenses like QA & testing, app store compliance, cloud hosting, maintenance, and marketing/user acquisition can add significantly to budgets.
- Cost Optimization: Focus on core outcomes, MVP discipline, phased development, selective cross-platform builds, and hybrid in-house/outsourced teams to control spending.
- Monetization Impact: Freemium, subscription, and ad-based models affect engineering scope, analytics needs, retention mechanics, and platform fees, impacting upfront and ongoing costs.
Mobile App Development Cost Breakdown: A Quick Overview
Wondering what causes a significant variation in the cost of mobile app development, ranging from as low as $40,000 to a massive $400,000 or more? The truth is: app development costs are largely driven by app complexity and features you include.
Here’s a quick breakdown to give you a sense of the cost spectrum before we dive into the critical details:
| App Type | Cost Range | Description |
|---|---|---|
| Simple Apps | $5,000 – $50,000 | Basic functionality (e.g., simple MVPs, static apps, prototypes). |
| Medium Apps | $50,000 – $120,000 | Moderate complexity (e.g., apps with user logins, APIs, integrations). |
| Complex Apps | $120,000 – $300,000+ | High complexity (e.g., real-time features, AI, geolocation, advanced UI). |
If you’re building an app like Uber, or one that requires real-time data and advanced functionality (e.g., AI, geolocation), you’re in the “complex” range.
Pro tip for investors is to focus on solving a real customer problem at scale rather than adding unnecessary features. It’ll help you manage cost expectations early on.
How to Estimate the Average App Development Costs?
Now, let’s talk about how to actually estimate costs, because as we both know, this isn’t just about taking a wild guess.
Tools and Frameworks to Use for Cost Estimation
Here’s the deal: I don’t rely on rough estimates. Instead, I use frameworks that help me break down the costs in a way that’s defensible and accurate:
Cloud Pricing Calculators: Platforms like AWS and Firebase have calculators to help forecast backend costs early on. These can be game-changers when you’re planning your infrastructure and scaling strategy.
Third-party API Pricing: Using services like Twilio or Stripe? Be aware of their pricing models (Twilio’s SMS pricing can surprise you, especially if your app uses OTPs).
I treat calculators as sanity checks, they’re useful to validate if you’re in the right ballpark. But remember: these tools can’t replace deep business analysis, and the more custom your app, the less useful generic calculators will be.
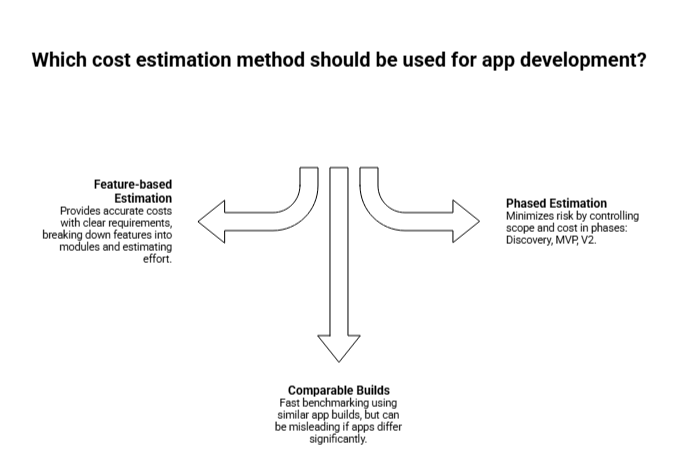
Estimation Methods I Recommend
- Feature-based (Scope → Modules → Effort): This is one of the most accurate ways to estimate costs when you have clear requirements upfront. You’ll break down features into modules and estimate the hours needed for each.
- Comparable Builds (Benchmarking): If you have access to similar app builds, use them to create a baseline. It’s fast, but be cautious, it can mislead you if your app differs significantly.
- Phased Estimation: I always advise CFOs to think in phases: Discovery → MVP → V2. This approach minimizes risk by controlling scope and cost in each phase.
Get Your App Cost Estimate Today
Know exactly what your app will cost before you start, no surprises, just clarity.
Factors Affecting Mobile App Development Cost in 2026: A Detailed Analysis
In 2026, mobile app development costs span a broad spectrum, with prices ranging from $40,000 for basic apps to over $400,000+ for enterprise-grade solutions. The costs are shaped by a variety of factors, and understanding each one is essential to making informed decisions that align with your business objectives.
Below, we break down these cost drivers, giving you detailed insights to navigate your app development journey effectively.
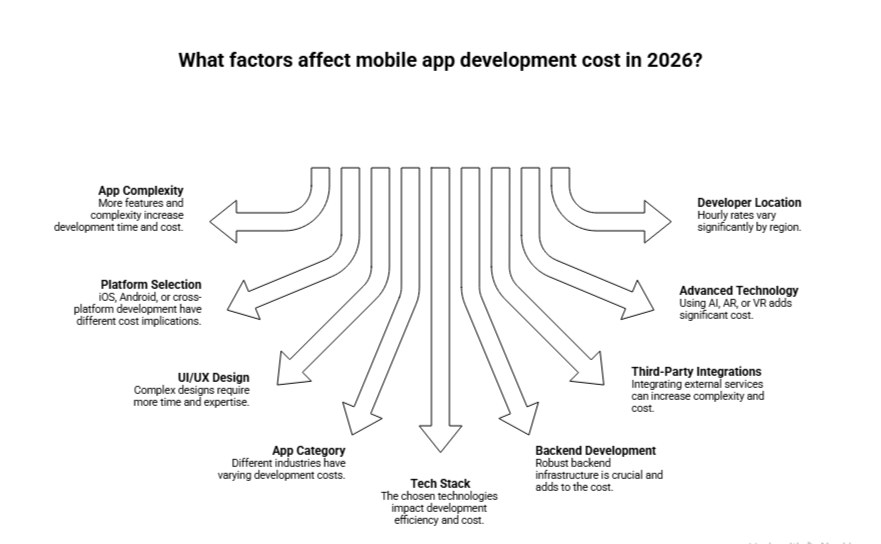
1. App Complexity & Feature Set
App complexity is the most significant cost driver, directly affecting development time, team size, and the technical complexity of the app. The more advanced your app’s features, the higher the development costs.
Here’s a quick breakdown of costs by complexity level:
| Complexity Level | Features Included | Development Time | Cost Range (USD) |
|---|---|---|---|
| Simple App | Basic UI, 3-5 screens, limited backend, user authentication, simple forms | 2-4 months | $25,000 – $70,000 |
| Medium-Complexity App | User accounts, payment integration, push notifications, social login, API integrations, admin panel | 4-9 months | $70,000 – $200,000 |
| Complex App | Real-time features, advanced integrations, scalable backend, multiple user roles, analytics dashboard, in-app messaging | 9-18 months | $200,000 – $500,000+ |
| Enterprise/AI-Powered App | AI/ML capabilities, IoT integration, blockchain, advanced security, compliance features, multi-tenant architecture | 12-24+ months | $300,000 – $1,000,000+ |
Suppose you’re building a ride-hailing app like Uber which requires multiple apps (Rider, Driver, Admin panel) with real-time GPS, payment processing, and matching algorithms. This can cost around $150,000 – $500,000+, with development time ranging from 9-15 months.
2. Platform Selection: iOS, Android, or Cross-Platform
Your platform choice dramatically impacts both initial development costs and long-term maintenance expenses. Here’s a comparison:
| Platform Strategy | Codebases | Cost Range | Time to Market | Best For |
|---|---|---|---|---|
| Native iOS Only | 1 | $30,000 – $150,000 | Medium | Premium iOS-focused markets |
| Native Android Only | 1 | $30,000 – $150,000 | Medium | Android-dominant regions |
| Native iOS + Android | 2 | $120,000 – $300,000+ | Slowest | Performance-critical apps |
| Cross-Platform (Flutter/React Native) | 1 | $50,000 – $250,000 | Fast | MVPs, SaaS, cost-effective launches |
AppVerticals built Spruce using React Native and helped the client save 30-40% of the cost they’d had to spend building separate native apps, while also maintaining 85-95% of native performance.
3. UI/UX Design Complexity
UI/UX design directly impacts user retention and overall app success. In 2026, users expect polished, intuitive interfaces across all industries, which can elevate your app’s user experience and ROI.
Here’s a breakdown of design costs:
| Complexity Level | Features Included | Development Time | Cost Range (USD) |
|---|---|---|---|
| Simple App | Basic UI, 3-5 screens, limited backend, user authentication, simple forms | 2-4 months | $25,000 – $70,000 |
| Medium-Complexity App | User accounts, payment integration, push notifications, social login, API integrations, admin panel | 4-9 months | $70,000 – $200,000 |
| Complex App | Real-time features, advanced integrations, scalable backend, multiple user roles, analytics dashboard, in-app messaging | 9-18 months | $200,000 – $500,000+ |
| Enterprise/AI-Powered App | AI/ML capabilities, IoT integration, blockchain, advanced security, compliance features, multi-tenant architecture | 12-24+ months | $300,000 – $1,000,000+ |
4. App Category and Industry Type
Different industries have specific needs, which directly impact costs. Healthcare apps, for instance, need to adhere to strict compliance rules, such as HIPAA, which increases costs.
AppVerticals built Visionse, which is a HIPAA-compliant app aimed at redefining mental healthcare through technology. The additional requirement of compliance added to the overall costs.
| Industry Category | Key Features | Development Cost (USD) | Timeline |
|---|---|---|---|
| E-commerce Apps | Product catalogs, payment gateways, inventory management | $80,000 – $300,000+ | 4-9 months |
| Healthcare Apps | HIPAA compliance, telemedicine, EHR integration | $200,000 – $1,000,000+ | 9-18 months |
| Fintech Apps | Secure transactions, KYC/AML compliance, banking integrations | $200,000 – $1,000,000+ | 9-18 months |
| Social Media Apps | Content feeds, real-time messaging, media handling | $150,000 – $500,000+ | 6-12 months |
| On-Demand Services | Real-time tracking, booking systems, multi-user roles | $150,000 – $500,000+ | 9-15 months |
5. Tech Stack
The choice of technology stack, including backend services, databases, and cloud infrastructure, can significantly affect both initial costs and ongoing expenses.
| Tech Stack Component | Description | Cost Range (USD) |
|---|---|---|
| Backend | Node.js, Ruby on Rails, Python | $20,000 – $60,000 |
| Database | SQL, NoSQL, Firebase | $5,000 – $50,000+ |
| Cloud Infrastructure | AWS, Google Cloud, Azure | $200 – $5,000+ monthly |
| Security | SSL certificates, encryption, GDPR compliance | $10,000 – $100,000+ |
6. Backend Development & Infrastructure
Backend complexity scales with user volume, data processing needs, and integration requirements.
Here’s how backend costs break down:
| Backend Complexity | Components | Cost Range |
|---|---|---|
| Basic Backend | Simple database, user authentication, basic API | $5,000 – $20,000 |
| Moderate Backend | User management, CMS, third-party integrations | $20,000 – $60,000 |
| Advanced Backend | Real-time data processing, scalable architecture, AI model deployment | $60,000 – $200,000+ |
Hidden Cost Alert: Cloud infrastructure (AWS, Google Cloud, Azure) can cost $200-$5,000+ monthly, depending on user base and data processing volume.
7. Third-Party Integrations
Integrating third-party services like payment gateways and analytics tools is essential for functionality but adds to both development and operational costs.
| Third-Party Service | Use Case | Cost Range (USD) |
|---|---|---|
| Payment Gateways | Secure transactions | 2.9% + 30¢ per transaction |
| Analytics | Data tracking and insights | $1,200 – $24,000 annually |
| Push Notifications | Real-time alerts to users | $1,000 – $10,000 annually |
| Authentication Services | User authentication | $2,000 – $20,000 annually |
8. Advanced Technology Integration
Cutting-edge technologies like AI, IoT, and Blockchain significantly increase development costs due to their complexity. Here’s a breakdown of these integrations:
| Technology | Features Included | Development Cost | Use Cases |
|---|---|---|---|
| AI/ML Integration | Recommendation engines, chatbots, NLP | $50,000 – $300,000+ | Personalization, automation |
| IoT Integration | Hardware connectivity, sensor data processing | $80,000 – $500,000+ | Smart home, wearables |
| Blockchain | Smart contracts, decentralized storage | $100,000 – $500,000+ | Fintech, supply chain |
| AR/VR | 3D modeling, virtual environments | $100,000 – $400,000+ | Gaming, retail |
9. Developer Location & Hourly Rates
Geographic location of your development team plays a crucial role in project costs. Here’s a breakdown of global hourly rates:
| Region | Hourly Rate Range | Quality Level | Communication |
|---|---|---|---|
| North America | $80 – $180+ | Premium | Excellent |
| Western Europe | $60 – $150 | High | Excellent |
| Eastern Europe | $35 – $80 | High | Very Good |
| Latin America | $30 – $70 | Medium-High | Good |
| India | $20 – $60 | Variable | Good |
Talk to an App Expert
Discuss your project with our specialists and get actionable guidance tailored to your goals.
The Hidden Costs That Can Derail Your Mobile App Development Budget
When advising executives on app development, I often stress that post-launch costs are just as critical, if not more, than the initial development phase. These costs can quickly add up and potentially derail your budget if not carefully accounted for.
While development costs are relatively easier to estimate, the hidden costs that come after launch can catch even seasoned executives by surprise.
Here’s a breakdown of these often-overlooked areas:
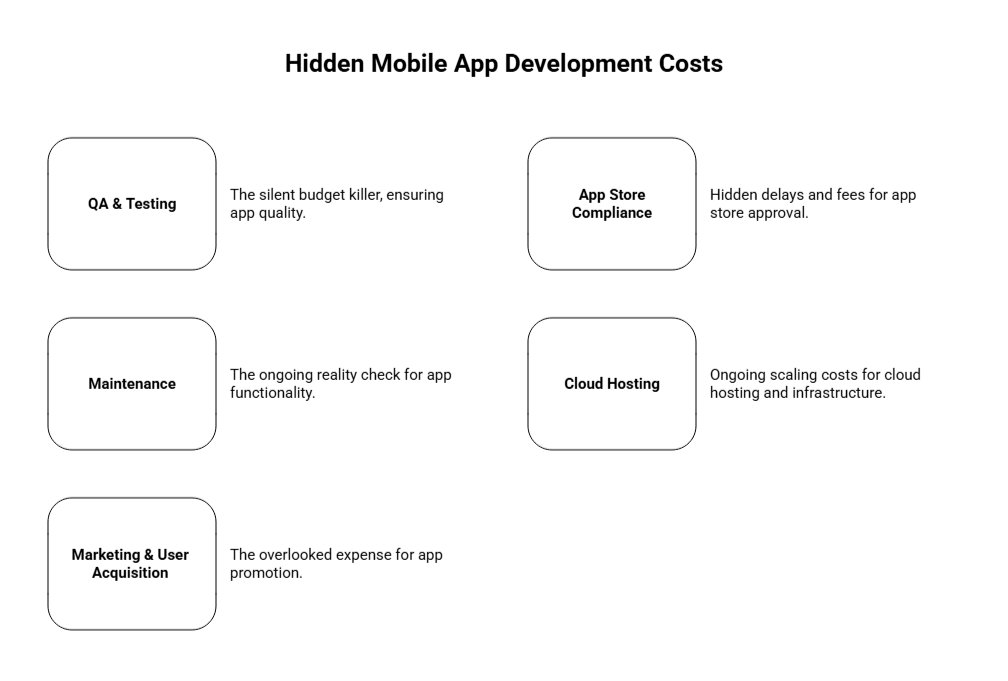
1. QA & Testing: The Silent Budget Killer
Testing is one of the most underestimated areas when it comes to app development costs. If you think your app is ready to go live after development, think again. Thorough Quality Assurance (QA) is essential to ensuring your app performs well across various devices, operating systems, and user conditions.
| Testing Type | Cost Range | Description |
|---|---|---|
| Manual Testing | $8,000 – $25,000 | Functional testing, usability testing, exploratory testing |
| Automated Testing | $10,000 – $30,000 | Regression tests, unit tests, integration tests |
| Performance Testing | $5,000 – $15,000 | Load testing, stress testing, scalability tests |
| Security Testing | $8,000 – $30,000 | Penetration testing, vulnerability assessments |
Testing can easily consume 15-25% of your total development budget. While it may seem like an additional, avoidable cost, poor testing can lead to app crashes, data breaches, and reputation damage, which in turn can be much more expensive to fix in the long run.
Effective testing not only ensures quality but also saves you 10x the cost of fixing bugs after launch, which can be disastrous for your app’s user retention and overall brand reputation.
2. App Store Compliance: The Hidden Delays and Fees
Navigating the App Store submission process can be a minefield. Apple’s App Store and Google Play each have strict guidelines, and ensuring your app complies with all their requirements is crucial for timely approval.
Here are some of the compliance-related costs you might encounter:
| Compliance Area | Potential Costs | Potential Delays |
|---|---|---|
| Apple App Store | $99/year (Developer Account) | Delays in approval due to metadata issues, missing demo accounts, or privacy disclosures |
| Google Play Store | $25 one-time (Developer Account) | Review delays (sometimes up to 7 days) for missing or incorrect information |
| App Store Optimization | $5,000 – $15,000 | Costs for keyword research, visual assets, and performance tracking post-launch |
Delayed Approvals
Delays during app store review periods can cost you more than just time, there’s a potential for lost revenue, missed launch windows, and even reputational damage. Ensuring your app meets all compliance standards upfront is an investment in smooth, hassle-free launches.
An app I worked on faced a 7-day delay during the Google Play review process because of incomplete metadata. The developer account fees and the time wasted caused unaccounted costs, and the delay reduced potential user acquisition in that window.
3. Maintenance: The Ongoing Reality Check
Once your app is live, the costs don’t stop there. App maintenance is a continuous commitment that ensures your app remains functional, secure, and relevant. On average, businesses spend 15-20% of the initial development cost each year on maintenance, which includes:
| Maintenance Tasks | Cost Range | Frequency |
|---|---|---|
| Bug Fixes & Updates | $5,000 – $20,000+ annually | Quarterly |
| Security Patches | $3,000 – $10,000+ annually | As needed |
| Operating System Updates | $2,000 – $10,000+ annually | Depends on OS releases |
| Feature Upgrades | $10,000 – $50,000+ annually | New features & improvements |
Why Maintenance Costs Add Up?
Maintenance costs rise as you add more features and users. Additionally, frequent OS updates (iOS/Android) and new device launches mean your app needs regular testing and updates to ensure it stays compatible and secure.
4. Cloud Hosting & Infrastructure: Ongoing Scaling Costs
As your app grows, so will your infrastructure costs. While the initial setup of servers, databases, and cloud services might seem manageable, the ongoing cloud hosting costs can skyrocket, especially for apps with large user bases or high data consumption.
| Infrastructure Costs | Monthly Cost Range | Description |
|---|---|---|
| Cloud Hosting (AWS/Azure) | $200 – $5,000+ | Depends on app traffic and data storage |
| CDN Costs | $500 – $3,000+ | Content delivery networks for global access |
| Database Costs | $200 – $5,000+ | Data storage, backups, and scaling |
Scaling Costs
As more users join your app, data storage, processing, and bandwidth requirements will increase. Services like AWS, Google Cloud, and Azure typically operate on usage-based models, meaning the more data your app handles, the more you’ll pay.
5. Marketing & User Acquisition: The Overlooked Expense
One of the largest hidden costs that often gets overlooked is user acquisition. The reality is, building an app is just part of the equation, and the real challenge comes in attracting and retaining users. The cost per install (CPI) benchmarks can range from $1.5 – $4.00 for Android and $1.5 – $3.5 for iOS, but North America often experiences higher rates.
| Marketing Expenses | Cost Range | Frequency |
|---|---|---|
| App Store Optimization (ASO) | $5,000 – $15,000+ | Pre-launch and ongoing |
| Paid Advertising | $50,000 – $200,000+ annually | Ongoing |
| Content Marketing | $30,000 – $100,000+ annually | Ongoing |
Cost of Acquiring Users
The initial marketing budget to acquire users can often exceed the cost of development, especially in competitive markets. Platforms like Facebook, Google Ads, and ASO (App Store Optimization) services can help, but they come at a price.
I always remind my clients: Don’t spend $150k building an app only to realize you don’t have enough budget to launch it effectively. Effective marketing and user acquisition strategy are essential for getting your app off the ground.
App Development Process Breakdown: Step-by-Step Cost Analysis (2026)
When executives ask me where the money actually goes during app development, this is the framework I walk them through. App costs don’t hit all at once, they accumulate across distinct phases, each with its own risk profile and budget impact. Skipping or underfunding any phase almost always results in rework, delays, or post-launch failures. Our mobile app development guide walks you through these phases with more detailed explanations to help you manage each stage effectively and optimize costs.
Below is a realistic, phase-by-phase breakdown of the mobile app development process in 2026, including cost ranges and what show up in real projects.
1. Discovery & Research Phase
This phase defines what you’re building and why. It includes market research, competitor analysis, technical feasibility checks, and scope definition. Strong discovery reduces scope creep later, weak discovery guarantees it.
I’ve seen teams save 30–40% in downstream costs simply by validating assumptions early instead of “figuring it out during development.”
| Activity | What’s Included | Cost Range (USD) |
|---|---|---|
| Market & Competitor Research | Market sizing, feature benchmarking | $2,000 – $6,000 |
| Product Requirements | User stories, feature prioritization | $3,000 – $10,000 |
| Technical Feasibility | Architecture planning, risk assessment | $2,000 – $7,000 |
| Total Discovery Cost | — | $7,000 – $25,000 |
2. UI/UX Design Phase
Design translates strategy into user flows, wireframes, and final visuals. In 2026, design is no longer cosmetic, it directly affects retention, conversion, and CAC.
Apps with poor UX don’t fail at launch, they fail at retention. Design fixes post-launch cost significantly more than doing it right up front.
| Design Stage | Deliverables | Cost Range (USD) |
|---|---|---|
| UX Architecture | User flows, wireframes | $4,000 – $15,000 |
| UI Design | Visual screens, design system | $8,000 – $35,000 |
| Animations & Micro-interactions | Transitions, feedback states | $3,000 – $25,000 |
| Total Design Cost | — | $15,000 – $60,000 |
3. Backend Development
This is the app’s foundation; databases, APIs, authentication, business logic, and integrations. Backend complexity grows with users, data, and real-time features.
Backend shortcuts are the most expensive mistakes I see. Scalability issues don’t show up at 1,000 users, they appear at 50,000.
| Backend Level | Scope | Cost Range (USD) |
|---|---|---|
| Basic Backend | Auth, database, simple APIs | $10,000 – $25,000 |
| Moderate Backend | Admin panel, integrations, caching | $25,000 – $60,000 |
| Advanced Backend | Real-time processing, scalable architecture | $60,000 – $200,000+ |
4. Frontend / Mobile App Development
This is where users interact with your product; iOS, Android, or cross-platform builds. Cost depends on platform choice, feature depth, and performance requirements.
Performance issues, crashes, or UI inconsistencies directly affect ratings, retention, and app store visibility.
| App Type | Platform Scope | Cost Range (USD) |
|---|---|---|
| Simple App | Single platform, limited features | $20,000 – $50,000 |
| Medium App | Cross-platform or dual native | $50,000 – $120,000 |
| Complex App | Real-time, AI, high performance | $120,000 – $300,000+ |
5. Third-Party Integrations
Instead of building everything from scratch, most apps rely on external services for payments, notifications, analytics, and authentication.
Integrations reduce development time, but increase long-term operational costs if not planned properly.
| Integration Type | Examples | Cost Impact |
|---|---|---|
| Payments | Stripe, PayPal | $3,000 – $10,000 |
| Messaging & Notifications | Firebase, Twilio | $2,000 – $8,000 |
| Analytics & Monitoring | Mixpanel, GA | $1,000 – $5,000 |
| Auth & Security | Auth0, OAuth | $2,000 – $10,000 |
6. Quality Assurance & Testing
Testing ensures the app works across devices, OS versions, and real-world conditions. Apps that skip proper QA don’t save money, they shift costs to user churn, negative reviews, and emergency patches.
7. App Launch & Store Deployment
This includes app store preparation, compliance checks, metadata, and final approvals. Apple and Google rejections cause delays, and delays increase burn rate.
| Testing Type | Coverage | Cost Range (USD) |
|---|---|---|
| Manual QA | Core flows, usability | $8,000 – $25,000 |
| Automated Testing | Regression, stability | $10,000 – $30,000 |
| Performance & Security | Load, stress, vulnerability testing | $5,000 – $20,000 |
| QA Total | — | 15–25% of dev cost |
8. Post-Launch Maintenance & Scaling
Once live, the app requires updates, security patches, OS compatibility fixes, and performance optimization. This is where many budgets collapse. Maintenance is not optional, it’s recurring.
| Maintenance Area | Annual Cost |
|---|---|
| Bug Fixes & Updates | 15–20% of initial dev cost |
| Cloud Hosting | $2,400 – $60,000+ |
| Security & Compliance | $5,000 – $50,000+ |
| Feature Enhancements | Variable |
What Do Popular App Types Actually Cost to Build in 2026?
We’ll have been there, estimating the cost of successful apps wondering how much it would cost to build an app like Uber, WhatsApp, etc. The answer is rarely a flat number. App types don’t drive costs on their own, the technical demands behind them do. Below is how I map common app categories to the cost drivers that actually move budgets.
Messaging Apps (WhatsApp-Style)
Messaging apps look simple on the surface, but they’re among the most technically demanding products to scale.
Primary cost drivers
- Real-time messaging infrastructure (WebSockets, pub/sub systems)
- Message delivery guarantees & retry logic
- Media storage and CDN costs
- End-to-end encryption and security audits
- Moderation tools and admin dashboards
- Push notification reliability at scale
Typical cost range
- $120,000 – $300,000+ for a production-ready MVP
- Ongoing costs increase with message volume (SMS, OTPs, verification)
Messaging apps rarely fail at build time, they fail when concurrency, reliability, or moderation isn’t engineered early.
E-Commerce Apps (Adidas-Style)
E-commerce apps are operational systems, not just storefronts. Their costs rise with scale, integrations, and performance expectations.
Primary cost drivers
- Product catalog & search performance
- Personalization and recommendations
- Payment processing and refunds
- Inventory and order management
- ERP / CRM integrations
- High-traffic performance during sales events
Typical cost range
- $80,000 – $250,000+ depending on integrations and scale
Margin reality: Payment processing (e.g., Stripe’s 2.9% + $0.30) directly impacts unit economics, this must be modeled during development, not after launch.
Ride-Hailing Apps (Uber-Style)
Ride-hailing apps are effectively three systems in one—and that’s where costs escalate.
Primary cost drivers
- Rider app + Driver app + Admin panel
- Real-time GPS tracking and routing
- Matching algorithms and surge logic
- Map usage (Google Maps billing changes matter here)
- Dispute resolution and support workflows
- Fraud prevention and rating systems
Typical cost range
- $150,000 – $500,000+
- 9–15 months for a stable, scalable release
Reality check: These apps are backend-heavy. Underinvesting in architecture almost guarantees scale problems.
Optimizing Development Costs (Without Killing ROI)
This is where I’m blunt with leadership teams: cost optimization is a strategy problem, not a staffing problem. Cheaper developers rarely fix expensive decisions.
Here’s how you can strategically optimize development costs without compromising on the quality:
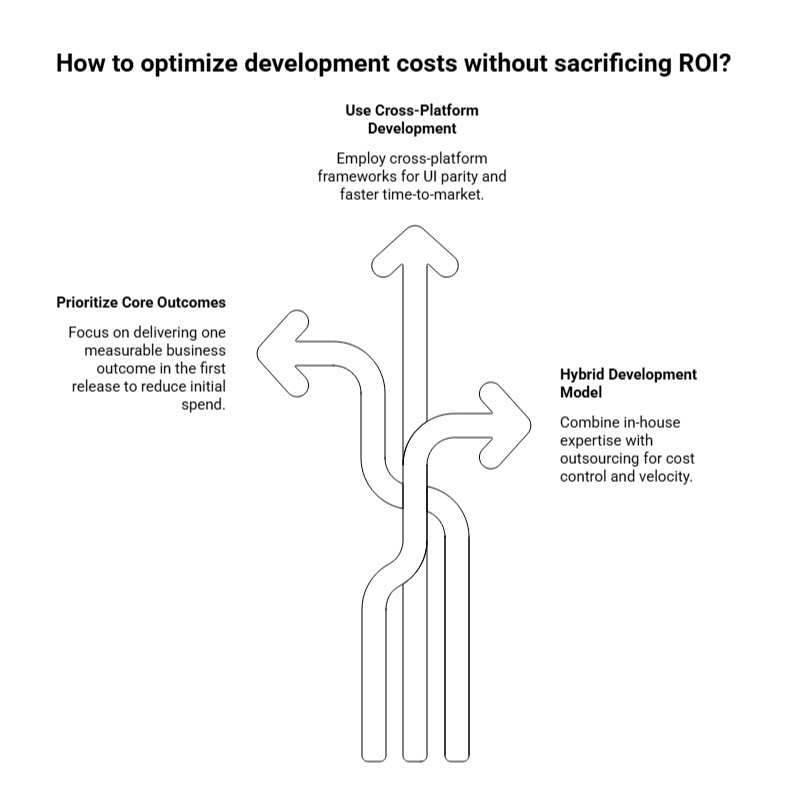
1. Prioritize Core Outcomes, Not Feature Lists
Your first release should prove one measurable business outcome:
- Revenue
- Retention
- Operational efficiency
- Risk reduction
- Everything else waits.
Teams that enforce MVP discipline often reduce initial spend by 40–60% without sacrificing long-term scalability.
2. Use Cross-Platform Development Selectively
Cross-platform frameworks work well when:
- UI parity is acceptable
- Time-to-market matters
- Hardware-level features are minimal
They are less suitable for:
- Hardware-intensive apps
- Advanced animations
- Platform-specific UX differentiation
Typical savings: 30–40% vs dual native builds—when used correctly.
3. In-House vs Outsourcing: The 2026 Reality
Most mature teams now use a hybrid model:
- Product ownership, architecture, and roadmap in-house
- Development execution via nearshore/offshore partners
This balances:
- Cost control
- IP ownership
- Delivery velocity
What’s the Most Cost-Efficient Way to Build an App?
The following process consistently produces the fewest surprises, and the strongest ROI.
- Market Research & Discovery: Define outcomes, constraints, and success metrics.
- Design: UX flows, prototyping, UI system, accessibility standards.
- Development: Frontend + backend + integrations, built in phases.
- Testing: QA coverage, performance testing, and security checks.
- Launch: Store compliance, rollout planning, release monitoring.
- Maintenance & Iteration: Analytics-driven updates, bug fixes, OS compatibility.
App Store and Google Play review timelines are real schedule risks, and that becomes cost risk when teams are idle or reworking submissions.
Schedule Your App ROI Strategy Call
Learn how to optimize development costs and maximize app ROI with our proven framework.
How Monetization Choices Change App Costs
Mobile app monetization isn’t just about revenue, it changes your engineering scope. Here’s the list of some very impactful app monetization strategies:
Freemium Models
It requires:
- Strong onboarding
- Retention mechanics
- Analytics and experimentation frameworks
- Lifecycle messaging
Cost implication: Higher upfront analytics and UX investment.
Subscription Models
It requires:
- Billing and entitlement logic
- Proration and upgrades
- Account recovery workflows
- Customer support tooling
- Platform fees to factor in
- Apple Small Business Program: 15% up to $1M
- Google Play: 15% for first $1M, then 30%
Ad-Based Revenue Models
It requires:
- Privacy-safe attribution
- Careful UX tradeoffs
- High DAU to offset CPI costs
ROI risk: Paid acquisition costs often exceed early ad revenue if retention is weak.
How AppVerticals Can Help Build a Cost-Effective Mobile Application?
AppVerticals helps teams control app development costs by turning business goals into a clearly scoped, phased build plan, so budgets are tied to outcomes, not assumptions. We focus on defining the right MVP, selecting fit-for-purpose technologies, and preventing scope creep before it turns into cost overruns.
Our teams design apps for iteration, not rework. That means scalable architecture, realistic timelines, and cost visibility at every stage, from discovery to post-launch optimization, so stakeholders can make informed decisions before costs escalate.
If your goal is to launch faster, spend smarter, and scale with confidence, AppVerticals provides the structure, technical expertise, and financial discipline required to build apps that deliver ROI without unnecessary spend.
Schedule Your App ROI Strategy Call
Learn how to optimize development costs and maximize app ROI with our proven framework.