
About Us
About Us
We’re a future-focused tech partner working with some of the world’s top enterprises. At AppVerticals, we design solutions that drive growth and reimagine digital experiences.

Services
Software Development
Mobile App Development
Web Design & Development
Tell us what you're looking for, and we'll tailor a solution based on your business needs.
Talk to Experts
Health Tech

EdTech

Logistics

Real Estate

Ecommerce

Sports

Fintech

Travel

Restaurant

Automotive
HIPAA-compliant digital solutions for hospitals, clinics, and healthtech startups driving better patient outcomes.
What we do:
Scalable learning platforms for schools, universities, and EdTech startups transforming education delivery.
What we do:
Real-time tracking and automation solutions for freight companies, warehouses, and delivery services.
What we do:
PropTech platforms for brokerages, property managers, and real estate marketplaces are streamlining operations.
What we do:
High-converting commerce platforms for D2C brands, retailers, and online marketplaces are driving revenue growth.
What we do:
Fan engagement platforms for sports teams, leagues, and betting operators are creating immersive experiences.
What we do:
PCI-DSS compliant solutions for digital banks, payment platforms, and InsurTech companies, ensuring security.
What we do:
Booking and hospitality solutions for OTAs, hotels, and tourism platforms, enhancing traveler experiences.
What we do:
Online ordering and operations software for restaurants, cloud kitchens, and food delivery platforms.
What we do:
Connected vehicle platforms for automotive OEMs, dealerships, and mobility providers are accelerating innovation.
What we do:
Portfolio

AppVerticals was featured in Inc. 5000 as
America’s Fastest Growing Tech Company
See what it might cost to bring your app idea to life. Our calculator gives you a quick, simple estimate based on what you need.

 verified expert
Senior Content Writer — Mobile & Software Development, AI
Zainab helps tech brands sound more human. She takes app ideas, features, and updates and turns them into content people actually want to read. Whether it’s for a launch, a campaign, or just making things...
See Full Bio12 minutes read
Supply chains in 2025 aren’t judged only on cost or speed, they’re measured by resilience, transparency, and adaptability. Yet, most logistics teams still operate in the dark. Over 60% lack real-time visibility into their networks, leaving businesses exposed to costly delays and inefficiencies.
The solution? Logistics dashboards, smarter, AI-driven platforms that transform raw data into action. From monitoring shipments in real time to forecasting inventory demand and controlling freight spend, dashboards are becoming the decision-making engines of modern supply chains.
For entrepreneurs and businesses, this isn’t just about better reporting. It’s about building supply chains that cut costs, retain customers, and stay disruption-proof. That’s why 2025 is the year to make dashboards a strategic priority.
Discover how a custom-built logistics dashboard can give your team real-time control and clarity.
A logistics dashboard is no longer just a reporting tool, it acts as a digital control tower, giving real-time visibility across transportation, warehousing, inventory, and order fulfillment.
The real competitive edge in 2025 lies in decision velocity: how fast you interpret data and act. Dashboards help turn data into proactive decisions.
Dashboards solve high-impact pain points: hidden delays, costly overstocking or stockouts, freight inefficiencies, and siloed operations.
Tracking the right metrics (e.g. on-time delivery, cost per unit, dwell time, perfect order rate) ensures dashboards drive ROI, not just noise.
Embedding predictive analytics and AI in logistics elevates dashboards from descriptive to prescriptive—predicting disruptions, optimizing routing, and supporting maintenance.
Choosing between off-the-shelf BI tools (like Power BI) and custom dashboards depends on your scale, complexity, and long-term growth ambitions.
A dashboard is a strategic investment: it can reduce costs, improve resilience, and build trust with customers, partners, and stakeholders.
In 2025, supply chain success isn’t defined by who collects the most data, it’s about who acts on it fastest. Legacy systems can generate reports. Spreadsheets can show past trends. But when a shipment is stuck at customs or your warehouse is running low on stock, yesterday’s data doesn’t solve today’s problem.
That’s why industry leaders are shifting their focus from static KPIs to a new performance benchmark: decision velocity, the ability to make fast, data-backed decisions in real time. According to BCG, companies that respond to disruptions quickly outperform slower competitors by up to 20% in recovery speed and customer satisfaction.
A modern logistics dashboard functions as a command center for decision velocity. Instead of waiting for end-of-day reports or juggling multiple systems, managers can:
Spot stalled shipments instantly with a transportation KPI dashboard
Detect sudden demand spikes through supply planning dashboards
Receive automated alerts for carrier delays or route congestion
Take corrective action before issues turn into customer complaints
For example, imagine a retailer using a Power BI dashboard connected to its transport and warehouse management systems. If a shipment is delayed due to port congestion, the dashboard can automatically suggest alternate routes, recalculate ETAs, and notify customer service teams—before customers even notice.
This shift from reactive reporting to proactive decision-making is what separates resilient companies from vulnerable ones. In today’s unpredictable market, speed is not optional—it’s your competitive edge.
A logistics dashboard isn’t just a screen filled with charts. Think of it as the control tower of your supply chain—a centralized hub that transforms complex, scattered data into clear, actionable insights in real time.
Instead of manually pulling reports from warehouse systems, transport tools, and carrier portals, a logistics dashboard aggregates everything into one unified view. This means your team can monitor shipments, inventory, costs, and carrier performance from a single interface—cutting hours of manual reporting and enabling faster action.
A logistics dashboard pulls live data from systems such as:
Warehouse Management Systems (WMS) – to track inventory levels and fulfillment rates
Transportation Management Systems (TMS) – for shipments, routes, and delivery status
Carrier APIs & IoT Sensors – to monitor delays, dwell times, and fleet performance
ERP & CRM Platforms – linking operational data with customer impact
Modern logistics dashboards often include:
Inventory monitoring across multiple regions and warehouses
Live shipment tracking with real-time delay alerts
Carrier performance metrics (on-time delivery, cost-per-mile, SLA compliance)
Freight cost analytics tied to route optimization
Order fulfillment metrics like fill rates, lead time, and cycle time
These features go beyond visibility—they give your business a direct lever to improve ROI by reducing delays, optimizing costs, and keeping customers informed.
“Out-of-the-box reports display what’s happening. Dashboards show why it’s happening—and how to fix it before it escalates.” — Forbes Agency Council
For businesses investing in logistics technology, this difference is crucial. Dashboards aren’t just about seeing your supply chain—they’re about controlling it with data-driven precision.
Today’s logistics leaders are drowning in data but starving for visibility. While systems like WMS, TMS, and ERPs generate plenty of information, very few companies can connect the dots fast enough to act. That’s why 60% of supply chain leaders admit they only see as far as their tier-1 suppliers.
A well-designed logistics dashboard closes these gaps, turning siloed, raw data into real-time insights that solve the challenges costing businesses millions every year.
Without end-to-end visibility, delays or shortages often go unnoticed until they become customer problems. Dashboards integrate live feeds from transportation systems, warehouses, and IoT sensors to give decision-makers a single source of truth.
Result: Spot disruptions before they escalate, improve transparency, and build customer trust.
Stockouts erode customer confidence, while overstocking locks up working capital. Dashboards track inventory levels across regions and apply AI forecasting to predict demand spikes.
Result: Balanced inventory, reduced waste, and more efficient cash flow.
Late deliveries don’t just frustrate customers—they drive up churn by 16% (PwC). A logistics KPI dashboard flags carrier or route patterns tied to delays, enabling managers to renegotiate contracts or reroute shipments.
Result: Higher SLA compliance, lower churn, and better customer satisfaction scores.
From empty miles to volatile fuel prices, logistics costs can spiral fast. Dashboards track spend by lane, carrier, and shipment type, while optimization algorithms highlight opportunities to consolidate loads or switch modes.
Result: 10–25% savings on freight spend, boosting margins directly.
When transportation, warehousing, and customer service teams work from disconnected systems, they spend more time syncing spreadsheets than solving problems. Dashboards centralize everything into one interface.
Result: Faster collaboration, proactive decision-making, and time saved from manual reporting.
Integrating dashboards into your custom logistics software cannot only help display metric, it can turn costly blind spots into opportunities for savings, growth, and resilience.
Talk to our experts and get a quick estimate based on your needs.
Dashboards aren’t just nice-to-have reporting tools—they’re built to unlock measurable ROI. By converting raw logistics data into real-time insights, they help companies cut costs, improve efficiency, and strengthen customer loyalty. Here’s how different players in the supply chain are putting them to work:
A mid-sized 3PL was losing thousands per month on trucks returning empty after drop-offs. By deploying a logistics dashboard with route optimization and load-matching, they identified backhaul opportunities across clients.
ROI Impact: 18% reduction in empty miles, saving over $500,000 annually on fuel and driver costs.
A U.S. retailer struggled with frequent stockouts of seasonal products. Their dashboard integrated POS sales data, supplier lead times, and demand forecasts. This enabled planners to rebalance inventory in real time.
ROI Impact: Stockouts dropped by 30%, while seasonal sales increased by 12% year-over-year.
An airline maintenance division faced compliance penalties due to delayed access to spare parts. With a real-time parts tracking dashboard, they gained visibility across suppliers and warehouses worldwide.
ROI Impact: Regulatory penalties decreased by 40%, and aircraft downtime was cut by 22%, leading to better on-time performance.
Volatile fuel prices and carrier surcharges were eroding margins for a freight forwarder. A dashboard consolidated lane-level costs and applied AI-driven fuel forecasts.
ROI Impact: Negotiated new carrier contracts, resulting in 15% freight cost savings within the first quarter.
Whether it’s cutting empty miles, reducing stockouts, or avoiding compliance risks, dashboards pay for themselves by turning visibility into direct financial results.
Not all dashboards are created equal. To move beyond vanity metrics and deliver real ROI, a logistics dashboard should focus on the KPIs that directly influence cost, efficiency, and customer satisfaction. Here are the must-track metrics every supply chain leader should demand:
Measures how many shipments arrive within the promised window.
Why it matters: Even a small dip in OTD can translate into lost customers and SLA penalties.
Tracks total logistics spend (fuel, carrier fees, surcharges) divided by units shipped.
Why it matters: Helps spot cost inefficiencies by lane, mode, or carrier—critical for margin control.
Shows how often stock is sold and replaced in a set period.
Why it matters: High turnover = better working capital efficiency; low turnover signals overstocking or weak demand planning.
Calculates the percentage of orders shipped correctly (right product, right quantity, right customer).
Why it matters: Every mis-pick or return adds costs and damages brand trust.
Tracks how long shipments sit idle at ports, warehouses, or checkpoints.
Why it matters: Extended dwell time = higher demurrage and detention fees, plus delayed deliveries.
Monitors environmental impact per ton-mile or shipment.
Why it matters: Sustainability isn’t just good PR, many shippers now require emissions reporting in RFPs.
Combines on-time, complete, damage-free, and accurate orders into one holistic metric.
Why it matters: This is the ultimate customer satisfaction KPI for logistics providers.
The real power of a logistics dashboard lies in tracking these KPIs in real time, not just monthly reports, so leaders can act before problems snowball into costs.
Don’t just track numbers—make them work for your business.
Traditional dashboards are descriptive—they tell you what happened. But in 2025, businesses can’t afford to only look in the rearview mirror. AI and predictive analytics are transforming logistics dashboards into forward-looking decision engines.
AI models ingest historical shipment data, weather conditions, port congestion, and geopolitical events to forecast delays.
Example: A predictive dashboard can flag a port closure risk in Asia days before it happens, giving shippers time to reroute cargo.
Instead of relying on static forecasts, AI-powered dashboards continuously adjust based on POS data, online sales, and market trends.
Example: A U.S. apparel retailer reduced seasonal overstocks by 20% after integrating AI demand forecasting.
Machine learning algorithms analyze fuel costs, traffic, and carrier performance to recommend the cheapest and fastest routes.
Example: A fleet operator achieved 15% lower fuel spend using AI-optimized routing.
IoT sensors in vehicles and warehouses feed into dashboards, allowing AI to predict equipment failures before they disrupt operations.
Example: Logistics firms cut downtime by 30% by shifting from reactive to predictive maintenance.
AI models estimate carbon emissions by shipment mode and suggest greener alternatives—critical as shippers demand ESG compliance.
Example: A freight forwarder won new contracts after showing real-time emissions dashboards during RFPs.
The shift is clear: AI turns dashboards from reporting tools into strategic command centers, helping leaders anticipate risks, optimize spend, and meet sustainability goals.
In today’s $18 trillion global logistics market, the companies that win aren’t just the ones with the biggest fleets or warehouse space—they’re the ones with the best visibility and fastest decision-making.
A well-designed logistics dashboard is no longer a “reporting tool.” It’s a strategic advantage that:
Cuts freight and operational costs by double digits.
Reduces compliance and customer service risks.
Improves resilience in the face of disruptions.
Builds trust with shippers, retailers, and end customers.
As AI, automation, and real-time data reshape supply chains, dashboards are becoming the nerve center of modern logistics operations. Companies that invest in logistics software development now will not just keep up with the market, they’ll outpace competitors, unlock new growth opportunities, and future-proof their supply chains.
If visibility is power, then a logistics dashboard is the engine that turns visibility into profit.
Stay ahead of disruptions, cut costs, and future-proof your logistics operations with a custom dashboard built for your business.
verified expert
Zainab helps tech brands sound more human. She takes app ideas, features, and updates and turns them into content people actually want to read. Whether it’s for a launch, a campaign, or just making things clearer, she’s all about simple words put together to form stories that stick.
 We’re AppVerticals
AppVerticals is where innovative startups and Fortune 500s come for transformation.
View About Us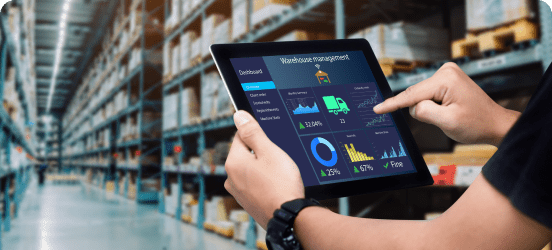 Custom Software
A warehouse management system in logistics helps businesses optimize supply chain operations by improving speed, accuracy, and visibility. It provides...
19 min read
 Custom Software
Dallas is a growing hub for tech and innovation. Over 300,000 professionals work across the Dallas-Fort Worth area. The city’s strong talent pool, inf...
16 min read
 Custom Software
Choosing from the many real estate software development companies in USA can be challenging, especially when every business has unique needs. The U.S....
15 min read
Discover how our team can help you transform your ideas into powerful Tech experiences.
AppVerticals © 2026 | All Rights Reserved
Get In Touch.


 ChatGPT
 Perplexity
 Google AI


