
About Us
About Us
We’re a future-focused tech partner working with some of the world’s top enterprises. At AppVerticals, we design solutions that drive growth and reimagine digital experiences.

Services
Software Development
Mobile App Development
Web Design & Development
Tell us what you're looking for, and we'll tailor a solution based on your business needs.
Talk to Experts
Health Tech

EdTech

Logistics

Real Estate

Ecommerce

Sports

Fintech

Travel

Restaurant

Automotive
HIPAA-compliant digital solutions for hospitals, clinics, and healthtech startups driving better patient outcomes.
What we do:
Scalable learning platforms for schools, universities, and EdTech startups transforming education delivery.
What we do:
Real-time tracking and automation solutions for freight companies, warehouses, and delivery services.
What we do:
PropTech platforms for brokerages, property managers, and real estate marketplaces are streamlining operations.
What we do:
High-converting commerce platforms for D2C brands, retailers, and online marketplaces are driving revenue growth.
What we do:
Fan engagement platforms for sports teams, leagues, and betting operators are creating immersive experiences.
What we do:
PCI-DSS compliant solutions for digital banks, payment platforms, and InsurTech companies, ensuring security.
What we do:
Booking and hospitality solutions for OTAs, hotels, and tourism platforms, enhancing traveler experiences.
What we do:
Online ordering and operations software for restaurants, cloud kitchens, and food delivery platforms.
What we do:
Connected vehicle platforms for automotive OEMs, dealerships, and mobility providers are accelerating innovation.
What we do:
Platforms
Our Odoo implementation brings financial discipline, operational visibility, and process control across departments. From accounting automation to manufacturing workflows, we design ERP systems that reduce operational leakage and provide real-time decision clarity.
We use Sitecore to drive measurable revenue growth through intelligent personalization and behavior-driven content delivery. By aligning marketing automation, data orchestration, and omnichannel engagement, we help brands turn digital touchpoints into retention engines.
We architect AWS environments that stay stable under scale, traffic spikes, and compliance pressure. From secure cloud migrations to CI/CD automation and cost governance, we engineer cloud foundations that protect performance while enabling rapid product evolution.
We implement Dynamics 365 to align systems with actual business operations, bringing clarity, control, and accountability across CRM, ERP, and service functions. From sales to finance, configurations eliminate inefficiencies and enable confident, real-time decisions.
Tell us what you're looking for, and we'll tailor a solution based on your business needs.
Talk to ExpertsPortfolio
AppVerticals was featured in Inc. 5000 as
America’s Fastest Growing Tech Company
See what it might cost to bring your app idea to life. Our calculator gives you a quick, simple estimate based on what you need.

 verified expert
AI & Data-Driven Content Strategist
Writes stat-driven, expert-backed blogs that simplify complex AI products and forecast what’s next.
See Full Bio18 minutes read
The global app economy is a juggernaut, with the Apple App Store ecosystem alone facilitating $1.3 trillion in developer billings and sales in 2024. Yet, as I consult with C-suite executives daily, I see a persistent hesitation: “Do we build a native app and hand over 30% to Apple, or do we build a web app and fight for user retention?”
This is not just a technical debate; it is a fundamental financial decision. With global consumer spending on apps reaching $167 billion in 2025, the stakes are incredibly high. The rise of AI-powered applications has further complicated the landscape, creating new revenue streams that defy traditional categorization.
In this article, I will move beyond the surface-level “pros and cons” to provide you with hard data. We will analyze revenue per download, retention rates, commission structures, and the exploding SaaS market to help you make an investment decision backed by the latest 2025–2026 statistics.
In 2025, global consumer spending on premium apps, in-app purchases, and subscriptions reached $167 billion, marking a 10.6% year-over-year increase. Despite market saturation, this steady growth confirms that users are increasingly willing to pay for high-value digital experiences.
The divide between the two giants continues to widen in terms of raw dollars:
$49 billion
Looking at quarterly trends, global in-app purchase (IAP) revenue reached $39.3 billion in Q1 2025 and rose to $40.9 billion in Q2 2025. This consistent quarter-over-quarter growth indicates a stable habit of digital spending among consumers.
| Metric | iOS | Android |
|---|---|---|
| Global User Share | 30% | 70% |
| App Revenue Share | 63% | 37% |
| Annual ARPU | $138 | $72 |
| Revenue Per Install (60 days) | $0.38 | $0.14 |
This table highlights that despite Android’s larger user base, iOS generates significantly more revenue per user and per install, making it the preferred platform for high-value app monetization.
For businesses targeting high-value iOS users, execution quality is critical. At AppVerticals, our mobile app development services are built to optimize performance, maximize subscriptions, and drive long-term retention, not just downloads.
Where is the money flowing? In 2025, we saw distinct winners:
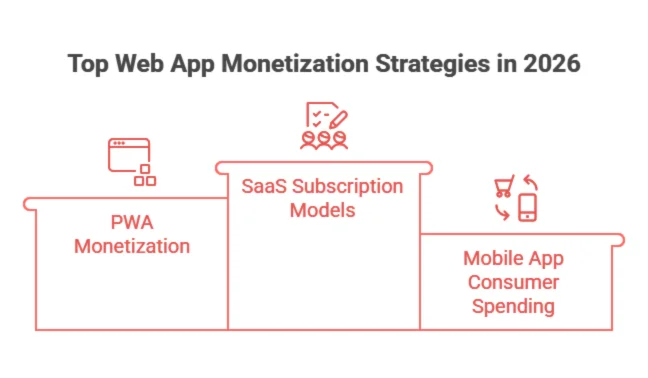
The SaaS market is robust. Valued at $408.21 billion in 2025, it is projected to grow to $465.03 billion in 2026. With a Compound Annual Growth Rate (CAGR) of 18.7%, this sector is creating massive enterprise value. Unlike mobile apps, which rely heavily on impulse purchases or microtransactions, SaaS web apps benefit from recurring, high-ticket B2B contracts.
Progressive Web Apps (PWAs) are no longer experimental. The market is projected to reach $21.44 billion by 2033, growing at a CAGR of 29.9%. By 2025, it is estimated that 65% of businesses will have adopted PWAs.
The performance benefits are tangible: businesses switching to PWAs report 36% higher mobile conversions and 50% faster load times. At AppVerticals, we design high-performance applications that combine search visibility with near-native retention mechanics, making them an increasingly strategic middle ground
To help you visualize the trade-offs, I have compiled a direct comparison of the economics of both platforms.
| Metric | Native App Store (iOS/Android) | Web App / SaaS |
|---|---|---|
| Revenue Potential | $167B Consumer Spend | $408B SaaS Market (B2B + Enterprise) |
| Commission / Fees | 15%–30% per transaction | ~2.9% + $0.30 per payment (Stripe/Processors) |
| Customer Acquisition Cost | High (CPI $4.70 iOS / $3.40 Android) | Moderate (SEO, Content, PPC) |
| Refund Rates | Higher (Store policies) | Lower (Controlled by merchant) |
Takeaway: For B2C apps, App Store access comes with higher fees but direct access to consumers. For B2B SaaS, web apps allow lower transaction fees and more predictable enterprise revenue.
Whether you need a high-ARPU iOS app or a margin-optimized SaaS platform, AppVerticals engineers products built for profitability, not just downloads.
ARPU, retention, and platform risk drive app profitability, determining revenue potential and business stability.
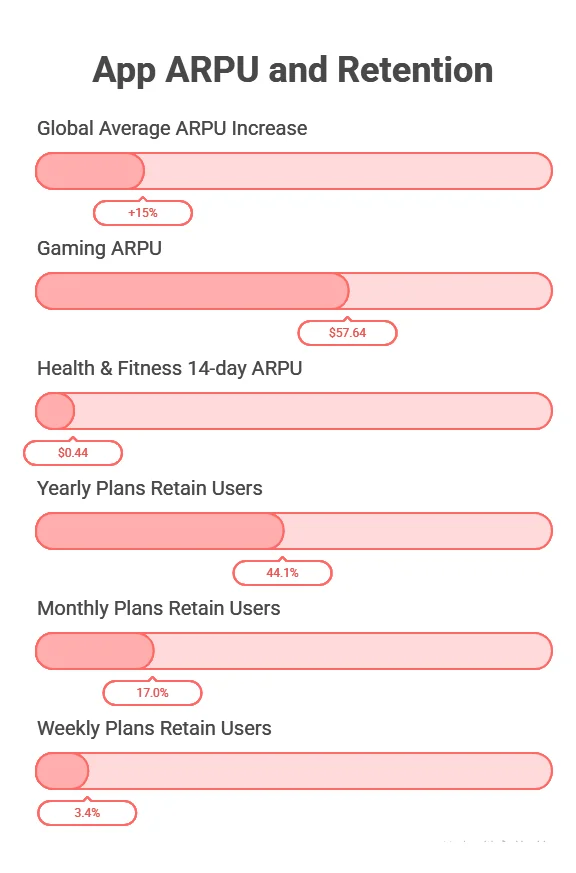
Global average ARPU for mobile apps increased by 15% to reach $4.80 in 2025. However, this average hides massive category variance. Gaming ARPU is significantly higher at $57.64. In the subscription space, Health & Fitness apps see a median 14-day ARPU of $0.44.
Retention is the silent killer of app revenue. Data shows that yearly plans retain 44.1% of users, while monthly plans retain only 17.0%, and weekly plans plummet to 3.4%. Web apps, particularly B2B SaaS, generally enjoy higher retention due to their integration into business workflows, whereas consumer mobile apps fight a constant battle against churn.
Native apps face “platform risk.” In 2024, Apple terminated over 139,000 developer accounts over fraud concerns. A policy change or an algorithm update can wipe out a business overnight. Web apps offer autonomy; you own the distribution channel, the payment relationship, and the customer data without a gatekeeper.
CAC, however, can increase dramatically for mobile apps due to rising CPI. Acquisition costs have surged globally over the past decade and remain high in core markets (e.g., iOS CPI ~$3.60‑5.50).
| Scenario | LTV | CAC | LTV: CAC | Status |
|---|---|---|---|---|
| Web SaaS Subscriptions | $300 | $80 | 3.75 | Healthy |
| Mobile App (iOS/Android) | $75 | $50 | 1.50 | Unsustainable |
The comparison shows why web apps often produce more efficient unit economics, because CAC doesn’t spike as much as in mobile paid acquisition channels.
Regulation is no longer an abstract risk; it already reshapes platform economics.
| Hybrid Strategy Element | Core Benefit |
|---|---|
| Web Billing + App Access | Lower fees, more pricing flexibility |
| In‑App Subscriptions + Ads | Smooth revenue diversification |
| Owned Media (email, push, SEO) | Better retention, reduced CAC reliance |
| Web‑to‑App Funnels | Taps untapped web audience for mobile installs |
Hybrid strategies help mitigate platform risks, distribute CAC spend more efficiently, and build multiple revenue levers (web + mobile + owned channels).
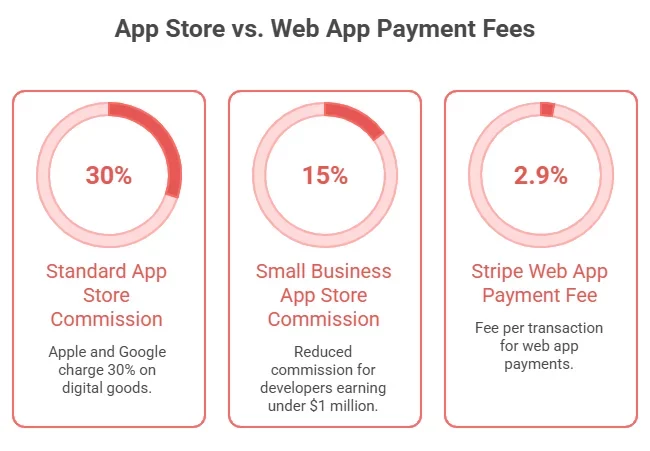
By default, Apple charges a 30% commission on all digital goods and services sold through the App Store. Google Play has a similar structure, charging 30% on revenues after the first $1 million.
However, it is crucial to note the exceptions. The App Store Small Business Program reduces the commission to 15% for developers earning less than $1 million per year. Google offers a similar 15% rate for the first $1 million in revenue annually for every developer.
Contrast this with the web. Using a provider like Stripe, you pay approximately 2.9% + $0.30 per transaction. For a business generating $500,000, the difference between paying 15% ($75,000) to Apple and ~3% ($15,000) to Stripe is $60,000 in pure profit. That is the capital that could fund two additional engineers or a marketing campaign.
A common question I receive from founders is, “What is a download worth?” Let’s break down the math.
Statista reports that the global average revenue per download is expected to amount to $1.86. However, platforms matter. As mentioned earlier, the App Store Revenue Per Install (D60) is $0.38 compared to Google Play’s $0.14.
The reality of monetization is harsh. Studies indicate that only 0.6–0.7% of new apps reach $100,000 in monthly revenue within their first 12 months.
The 1,000 Download Formula:
Using the global average:
1,000 Downloads × $1.86 = ~$1,860 Total Revenue
Note: This is an average. High-performing apps can see revenue per install of $0.63 or higher within 60 days.
Profitability depends entirely on your business model.
Gaming remains the revenue giant with $82 billion on iOS, but growth has slowed to roughly 1% YoY. In contrast, non-game apps surged 21% year-over-year to reach $85.6 billion. Meanwhile, the SaaS web market is vast ($408B+) and growing steadily at an 18.7% CAGR.
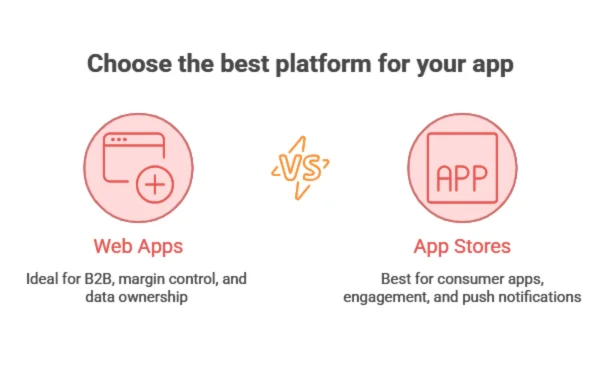
Web apps win in the B2B space. If you are building enterprise resource planning (ERP) tools, CRM software, or niche B2B platforms, the web offers higher margins (no 30% fee) and lower friction (no download required). Cross-platform compatibility is inherent, reducing development costs.
Many B2B platforms we build at AppVerticals prioritize margin control and data ownership. Our custom web application development helps businesses reduce platform dependency while maximizing recurring revenue.
If your product relies on consumer impulse, social interaction, or high-performance graphics (like gaming), the App Store is unbeatable. The frictionless “double-click to pay” mechanism of Apple Pay and the push notification ecosystem drive engagement that web apps struggle to match.
Investment cost is only one half of the profitability equation; development cost, platform fees, maintenance, and monetization structure all impact ROI differently on mobile vs web.
Here’s a data‑verified breakdown of development and revenue dynamics for mobile apps and web applications:
In contrast, the web app / SaaS ecosystem is being valued for enterprise subscription revenue rather than consumer micro‑transactions.
Mobile app development costs largely depend on complexity, platform, and feature set.
| App Type | Development Cost Estimate |
|---|---|
| Simple Mobile App | ~$25,000 – $60,000 |
| Mid‑Complex Mobile App | ~$60,000 – $120,000 |
| Complex Mobile App | ~$120,000 – $500,000+ |
Notes: Community and industry breakdowns show that development cost estimates vary by platform and feature scope, but seasoned estimates align with the above ranges for modern app builds.
Web apps, especially SaaS, PWAs, and enterprise dashboards, usually cost 20–40% less in upfront development compared to mobile apps because they use a single codebase and don’t require separate iOS + Android builds.
| Web App Type | Typical Cost Range |
|---|---|
| Simple / MVP Web App | ~$20,000 – $40,000 |
| Mid‑Tier Web App | ~$40,000 – $100,000 |
| Complex SaaS Web Platform | ~$100,000 – $350,000+ |
Maintenance isn’t just a number; it’s recurring CapEx that impacts profitability:
| Platform | Fee Structure |
|---|---|
| Mobile App Stores (Apple/Google) | 15–30% commission on digital sales |
| Web Apps (Stripe/Square) | ~2.9% + $0.30 per transaction |
Contrasting these fee structures clearly shows the impact on profitability at scale, especially for subscription and digital goods revenue.
For example, A business earning $500,000 paying ~15% in platform commission loses ~$75,000, whereas the same volume via Stripe fees (~3%) might cost just ~$15,000.
(The comparatively low web fee structure is well known among product monetization experts and reflected across web monetization guidance.)
| Metric | Mobile App | Web App |
|---|---|---|
| Upfront Development Cost | Higher | Lower |
| Ongoing Maintenance | Higher | Lower |
| Platform Fee / Commission | 15–30% | ~3% + fixed |
| Time to Market | Longer due to separate releases | Shorter via single deploy |
| Monetization Focus | Consumer in‑app purchases/subscriptions | Recurring SaaS revenue, enterprise contracts |
| CAC Impact | Higher user acquisition costs via CPI & ads | Lower CAC via SEO, content marketing |
In short, Web apps typically outperform mobile apps in unit economics due to:
Meanwhile, mobile apps still generate significant consumer revenue (e.g., $167 billion in 2025 mobile spend) and are excellent for engagement-intensive products, but their higher acquisition and fee structures must be factored into profitability modeling.
One of the strongest real‑world indicators of mobile app economics is how much revenue developers generate through the App Store. In 2024, the Apple App Store ecosystem in the U.S. facilitated $406 billion in developer billings and sales, nearly tripling since 2019 (from $142 B). Developers’ earnings more than doubled over that period.
In 2024, developers on the Apple App Store in India generated $5.3 billion in billings and sales. Notably, a large share (~94%) of this commerce accrued directly to developers, meaning Apple wasn’t taking commission on the majority of these transactions (often physical goods or services).
Progressive Web Apps are often overlooked but can unlock significant improvements in engagement and conversions:
Though not a classic mobile vs web case, Slack remains one of the best-documented SaaS growth and revenue model case studies. Within eight months of launch, it reached a $1 B valuation and grew to >$100 M annual recurring revenue (ARR) within a few years, showcasing the power of subscription‑driven web revenue.
By 2026:
While mobile continues expanding in consumer engagement, web-based SaaS platforms are growing faster in enterprise revenue concentration and margin efficiency.
By 2026, experts at AppVerticals predict a hybrid strategy will not just be an option, but a requirement for market dominance.
verified expert
Writes stat-driven, expert-backed blogs that simplify complex AI products and forecast what’s next.
 We’re AppVerticals
AppVerticals is where innovative startups and Fortune 500s come for transformation.
View About Us Web App
In today’s digital-first economy, web applications have become more than just online tools, they are the backbone of modern businesses. From streamlin...
16 min read
 Web App
By 2026, more than 70% of new enterprise applications will include components built with low-code or no-code platforms, a structural shift in how soft...
19 min read
 Mobile App
Looking for the most popular shopping apps in UAE? The region’s online retail market is growing fast, with users seeking apps that offer smooth browsi...
6 min read
Discover how our team can help you transform your ideas into powerful Tech experiences.
AppVerticals © 2026 | All Rights Reserved
Get In Touch.


 ChatGPT
 Perplexity
 Google AI


